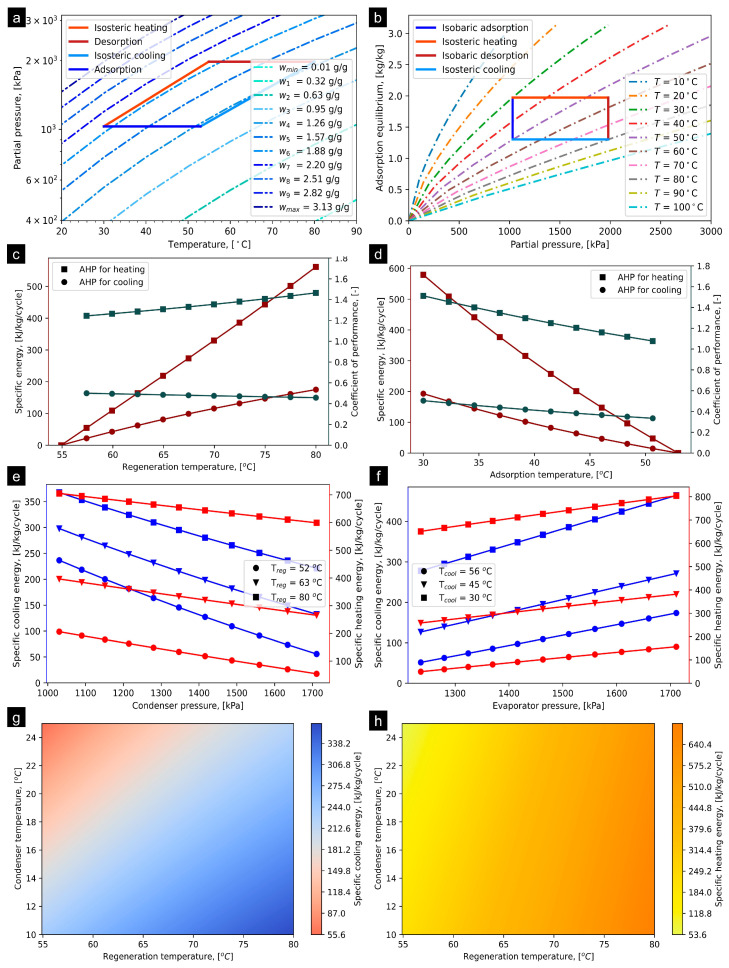
Figure 5.
(a) P–T–U diagram of SAC/HFC-32 pair at Tevap = 10 °C and Tcond = 30 °C, (b) simulated adsorption equilibrium profiles entailing ideal AHP cycle, (c) effect of Treg on SCE and COP, (d) effect of Tcool on SCE and COP, (e) effect of condenser pressure on SCE and SHE, (f) effect of evaporator pressure on SCE and SHE, (g) SCE production corresponding to variation in Treg and Tcond at Tevap = 10 °C, and (h) SHE production corresponding to varying Treg and Tcond at Tevap = 10 °C.

