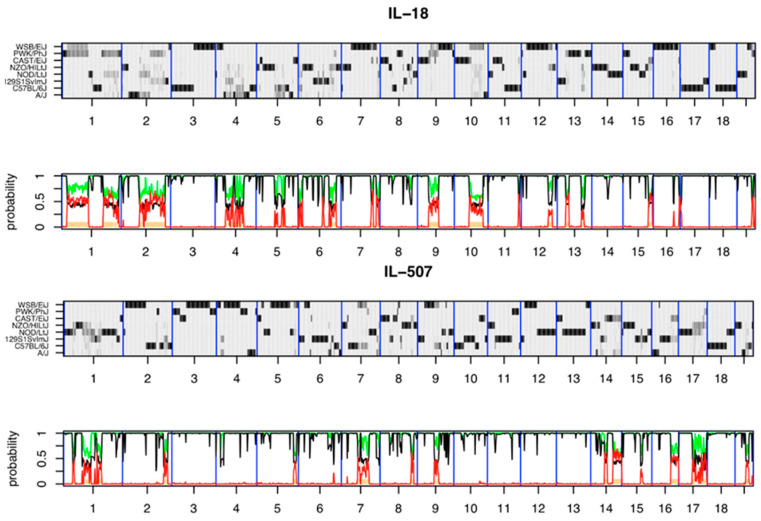
Figure 9.
Reconstructions of the genomes of the representative CC lines IL-18 and IL-507 from the hidden Markov model (HMM) were implemented by HAPPY. The x-axis shows the 19 autosomes. Each reconstruction is represented by two panels: the top panel y-axis shows the 8 CC founders, and the probability of descent from a founder at a locus is represented by the shade of grey, with white = 0 and black = 1. The regions where a single haplotype predominates appear as dark horizontal bands; loci with residual heterozygosity or where the founder haplotypes are indistinguishable are paler grey. The lower panel indicates local heterozygosity (red), the posterior probability of the most probable founder (black), and the sum of the most probable pair of founders (green) [80].

