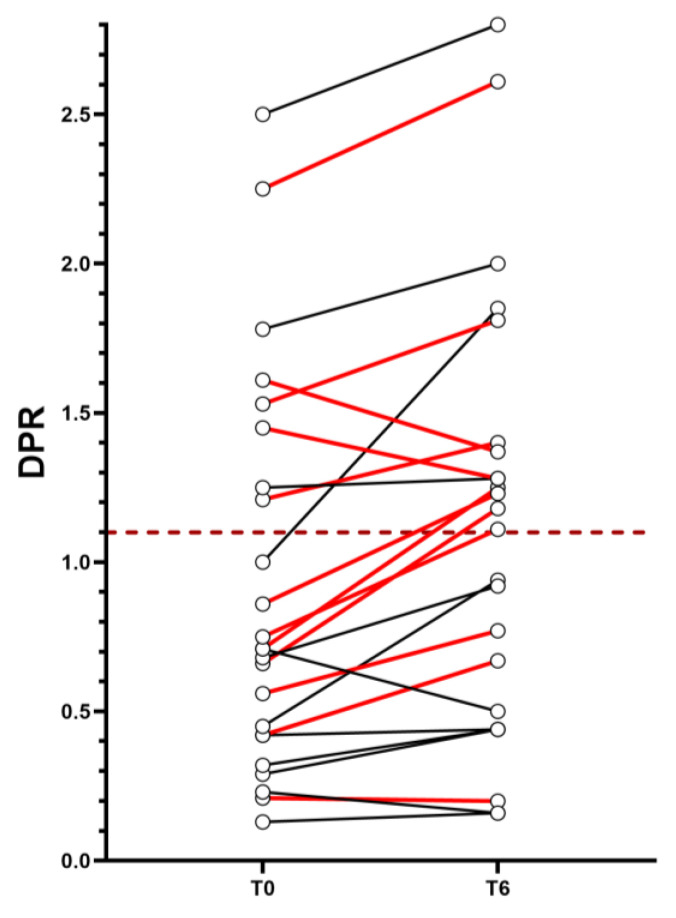
Figure 2.
DPR values for single subject at T0 and T6. The graph shows the trend of DPR per subject from T0 (left) to T6 (right). The dashed horizontal line identifies the boundary between DPR-N (below it) and DPR-F (above it). The red connecting lines between the two time points identify subjects belonging to the MUNIX-Low group, while the black connecting lines identify subjects not belonging to the MUNIX-Low group. Abbreviations: DPR = disease progression rate.

