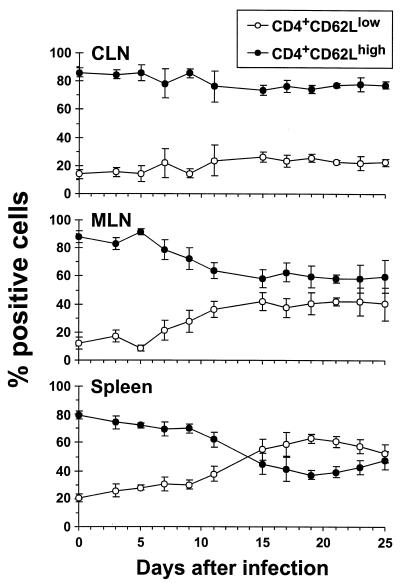
FIG. 2.
Phenotypic analysis of the total CD4+ T-cell population. B6 mice were infected i.n. with 600 PFU of MHV-68, and CLN, MLN, and spleen cells from individual animals were stained with MAbs to CD4 and L-selectin (CD62L) for flow cytometric analysis. Data points represent means ± SD for four to five animals, expressed as percent CD4+ T cells.

