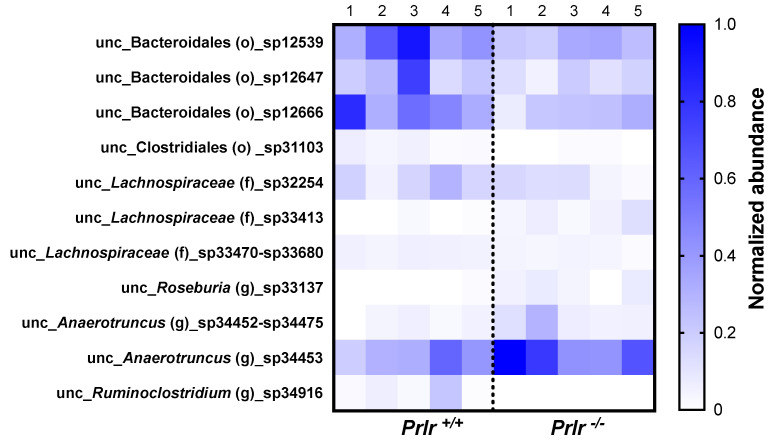
Figure 5.
Significantly different bacterial species between the 21-day-old pups in each group (five samples from each group were taken, each representing three mice). The values are presented in normalized abundances after a min-max normalization [(sample − min)/(max − min)]. F, family; G, genus; O, order; UNC, unclassified.

