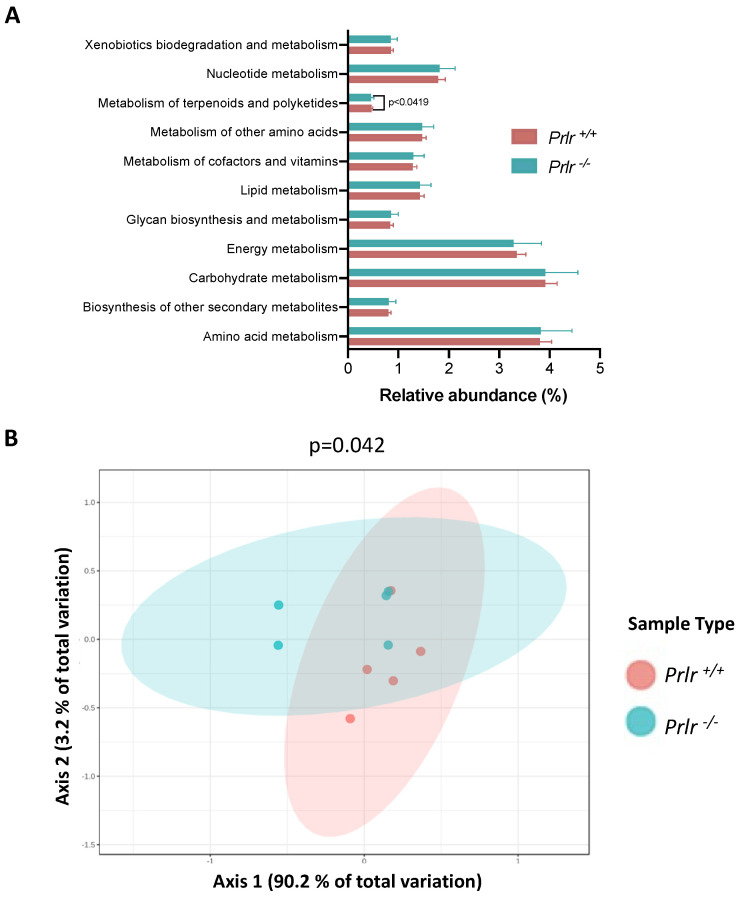
Figure 6.
PICRUSt metabolic prediction based on species compositions from the 21-day-old weaned mice. (A) Relative metabolic abundances for each group. (B) PCoA analysis of the metabolic performances. The data in (A) are presented as the mean ± SD of 469 identified species. The differences in (A) were evaluated through a Kruskal–Wallis test (p < 0.05). The differences in (B) were assessed using a PERMANOVA test (p < 0.05). Each dot in (B) represents three mice.

