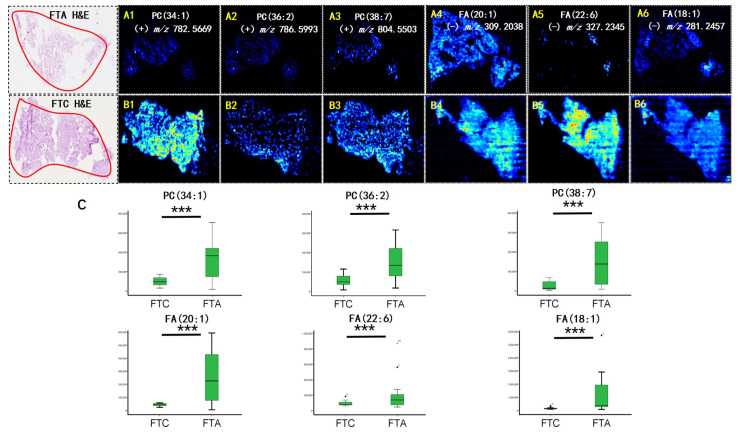
Figure 2.
Air flow-assisted desorption electrospray ionization mass spectrometry imaging (AFAIDESI-MSI) of follicular thyroid adenoma (FTA) and follicular thyroid carcinoma (FTC). The distribution of (A1,B1) m/z 782.5669, PC (34:1); (A2,B2) m/z 786.5993, PC (36:2); (A3,B3) m/z 804.5503, PC (38:7); (A4,B4) m/z 309.2038, FA (20:1); (A5,B5) m/z 327.2345, FA (22:6); (A6,B6) m/z 281.2457, FA (18:1). (C) The statistical box plots display the intensity of metabolites. *** p < 0.001. H&E, hematoxylin and eosin.

