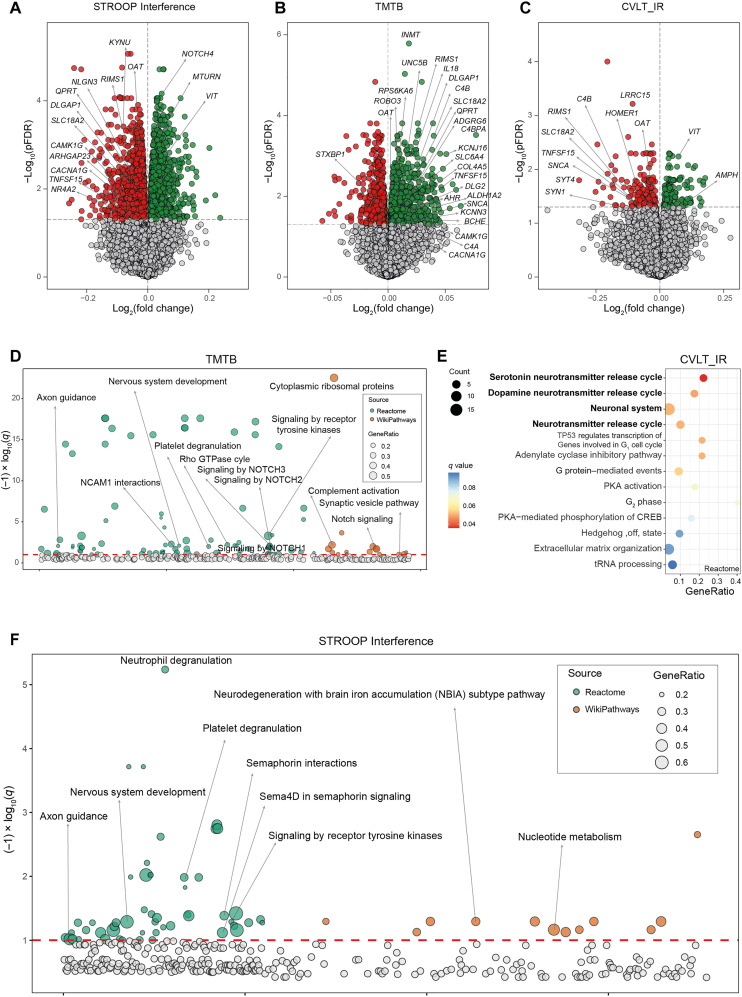
Fig. 1. Associations of VAT gene expression and cognitive domains in the discovery cohort.
Volcano plots of differentially expressed genes in the VAT associated with (A) the STROOP Interference tests, (B) the trail making test part B (TMTB), and (C) California verbal learning test immediate recall (CVLT_IR) scores in discovery cohort (IRONMET, n = 17) identified by limma-voom analysis controlling for age, BMI, sex, and education years. The log2 fold change associated with a unit change in the cognitive test score and the log10 P values adjusted for multiple testing (pFDR) are plotted for each gene. Differentially expressed genes (pFDR < 0.05) are colored in red and green indicating down-regulation and up-regulation, respectively. (D) Manhattan-like plot of pathways significantly associated (q < 0.1) with the TMTB in the VAT identified from a pathway overrepresentation analysis mapping significant genes to the Reactome and WikiPathways databases. (E) Dot plot of pathways significantly associated (q < 0.1) with the CVLT_IR in the VAT identified from a pathway overrepresentation analysis mapping significant genes to the Reactome database. Dots are colored by the q value. (F) Manhattan-like plot of pathways significantly associated (q < 0.1) with the STROOP Interference in the VAT identified from a pathway overrepresentation analysis mapping significant genes to the Reactome and WikiPathways databases. In the Manhattan-like plots, the bubble size represents the ratio of input genes that are annotated in a pathway (GeneRatio). CREB, adenosine 3′,5′-monophosphate response element–binding protein; tRNA, transfer RNA; NCAM1, Neural Cell Adhesion Molecule 1; TP53, Tumor Protein 53; PKA, Protein Kinase CAMP-Activated Catalytic Subunit Alpha.

