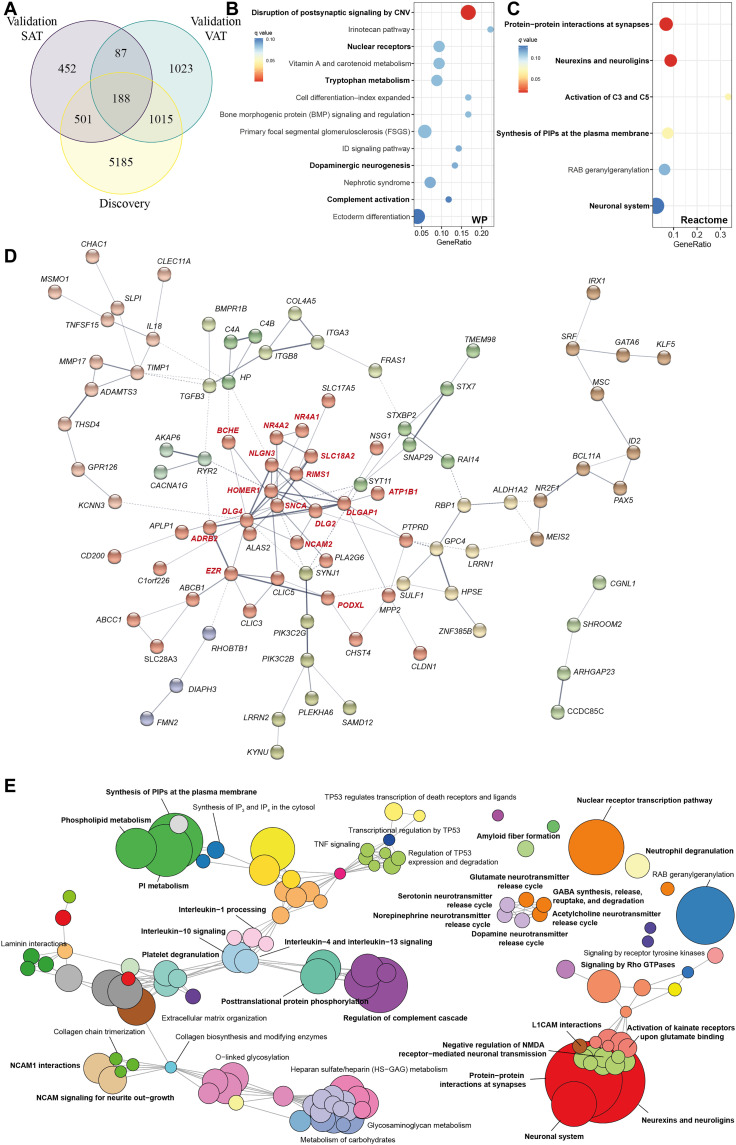
Fig. 3. Pathway analysis of differentially expressed genes in common among the VAT and SAT in the discovery and validation cohorts (n = 188).
(A) Venn diagram representing the overlap of significant genes associated with at least one cognitive test in VAT of the discovery cohort, the VAT of the validation cohort, and the SAT of the validation cohort. (B) Dot plot of significantly overrepresented pathways (q < 0.1) mapping common differentially expressed genes (n = 188) to the WikiPathways and (C) Reactome databases. The x axis in the dot plots represents the ratio of input genes that are annotated in a pathway (GeneRatio). Dots are colored by the q value. (D) Gene-gene interaction network constructed using common differentially expressed genes via the STRING database. The network nodes are genes, and the edges represent the predicted functional interactions. The thickness indicates the degree of confidence prediction of the interaction. Functional gene clusters are colored on the basis of the Markov cluster algorithm (MCL) with an inflation parameter of 1.4. Only connected nodes are shown. A highly connected functional cluster (in red) was detected comprising genes with important roles in the CNS. (E) Enrichment map of the interrelation of significant pathways identified using an active subnetwork oriented approach. Each color displays a cluster of related pathways using a threshold for kappa statistics = 0.35. The size of the nodes corresponds to its −log10(pFDR). The thickness of the edges between nodes corresponds to the kappa statistic between the two nodes. IP3, inositol 1,4,5-trisphosphate; IP4, inositol 1,4,5,6-tetrakisphosphate; PI, phosphatidylinositol; TNF, tumor necrosis factor; NMDA, N-methyl-d-aspartate; CNV, copy number variations; L1CAM, L1 Cell Adhesion Molecule.

