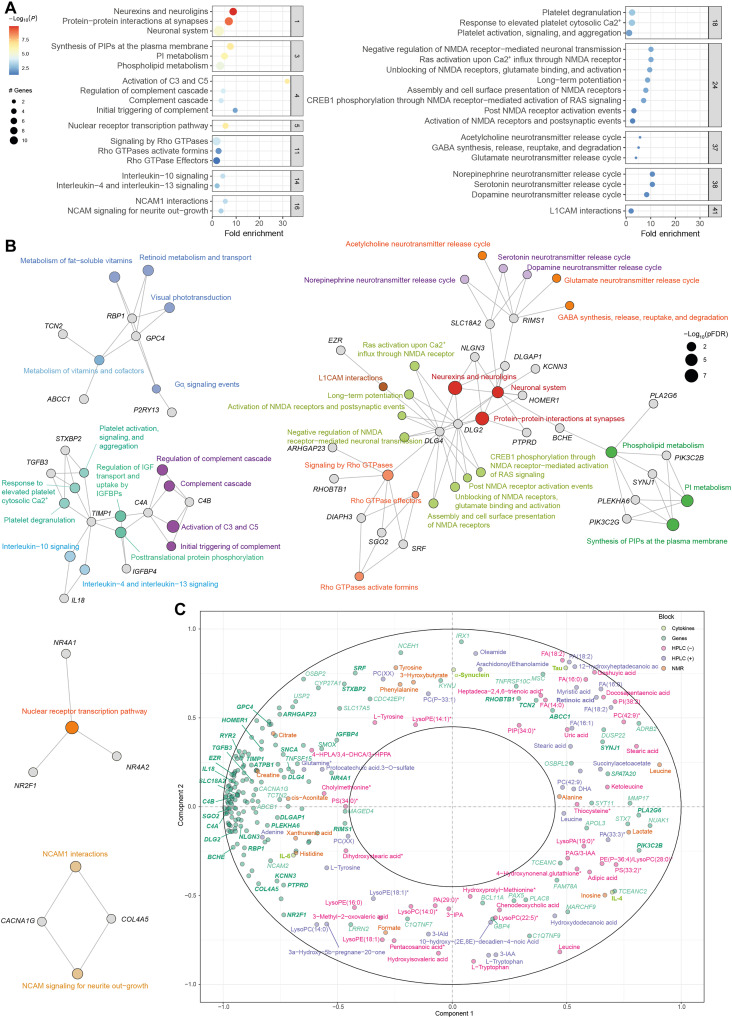
Fig. 4. Selected clusters from active subnetwork oriented pathway analysis of common significant genes among the VAT and SAT in the discovery and validation cohorts (n = 188) and integration with circulating metabolites.
(A) Dot plot of enrichment analysis results performed on active subnetworks grouped by selected clusters. The x axis represents the fold enrichment defined as the ratio of the frequency of input genes annotated in a pathway to the frequency of all genes annotated to that pathway. The dot size indicates the number of differentially expressed genes in a given pathway. Dots are colored by the –log10(pFDR), with red indicating high significance. (B) Gene-concept network depicting significant genes involved in enriched pathways from selected clusters. The dot size of the pathways represents the −log10(pFDR). Pathways with the same color correspond to the same cluster. (C) Correlation circle plot for the integration of the adipose tissue genes, metabolites (NMR, HPLC-ESI-MS/MS in positive and negative mode), and cytokines and neurotoxic proteins using a multiblock PLS model in canonical mode. Strongly positively associated variables or groups of variables are projected close to one another on the correlation circle (<0° angle). The variables or groups of variables strongly negatively associated are projected diametrically opposite (<180° angle) on the correlation circle. Variables not correlated are situated <90° from one another.

