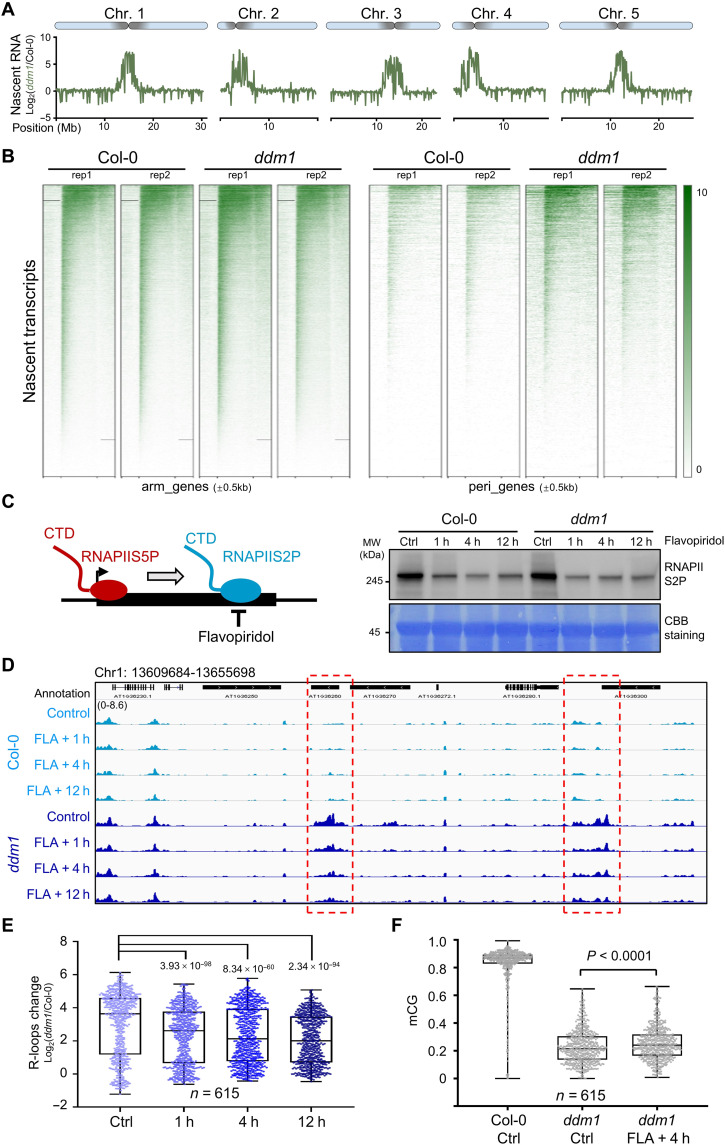
Fig. 2. Cotranscriptional R-loop accumulation disturbs pericentromeric heterochromatin formation in ddm1 mutant.
(A) Nascent RNA enrichment [log2NET-seq(ddm1/Col-0)] plotted on 5 chromosomes. (B) Heat maps showing pNET-seq of WT and ddm1 at genes on chromosome arms (n = 26,106) and from pericentromeric regions (n = 7217). The color bar shows RPGC (reads per genomic content, 1× normalization) values. (C) Left: Cartoon showing the chemical FLA is used to inhibit phosphorylation of RNAPII CTD at serine 2 (RNAPIIS2P). Right: Western blot showing RNAPIIS2P abundance after FLA treatment. Plants treated with dimethyl sulfoxide for 12 hours were used as controls. Membrane was stained with CBB (Coomassie Brilliant Blue) as a loading control. MW, molecular weight. (D) Snapshots from Integrative Genomics Viewer showing R-loop levels after FLA treatment. Regions with decreased R-loop levels during FLA treatment are highlighted in red boxes. (E) Box and whisker plot showing R-loop changes Log2(ddm1/Col-0) after FLA treatment at regions with increased R-loops in ddm1 (data from Fig. 1A, n = 615). Minimum to maximum and interquartile range are shown. (F) Box and whisker plot showing CG DNA methylation levels after 4 hours of FLA treatment. Min to max and interquartile range are shown.

