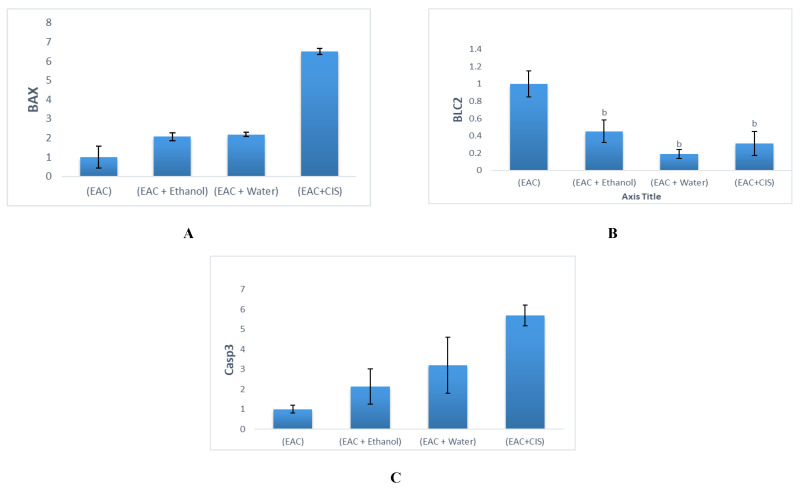
Figure 4.
Analysis of PCR product of: (A) Bax gene, (B) Bcl-2 gene, and (C) Caspase-3 gene in tumor mass in different experimental groups by using RT-PCR. Results were expressed as mean ± SEM (n = 10). b p < 0.001 from the EAC group. p < 0.001 from the EAC + Ethanol group. p < 0.001 from EAC + Water groups.

