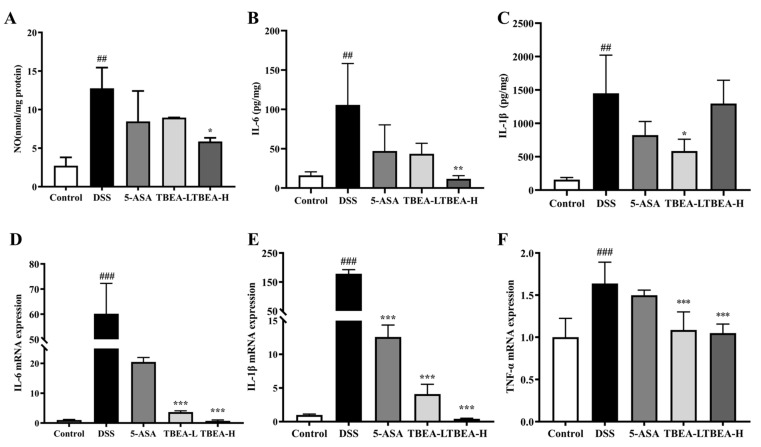
Figure 7.
Measurement of pro-inflammatory cytokine contents: (A) NO content, (B) IL-6 content, (C) IL-1β content, (D) relative mRNA expression of IL-6, (E) relative mRNA expression of IL-1β, and (F) relative mRNA expression of TNF-α. TBEA-L, TBEA-low dose (50 mg/kg); TBEA-H, TBEA-high dose (100 mg/kg); 5-ASA, 5-aminosalicylic acid (200 mg/kg). ## p < 0.01, ### p < 0.001 compared with the control group, and * p < 0.05, ** p < 0.01, *** p < 0.001 compared with the model group (n = 3).

