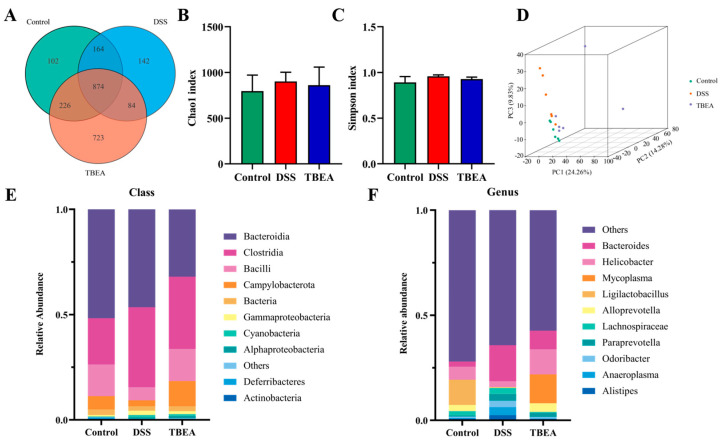
Figure 9.
TBEA regulates the gut microbiota in DSS-induced UC mice. (A) Venn diagram of species in the three groups. (B) The Chao1 index is higher, and the species abundance is more elevated. (C) The Simpson index is closer to 1, and the species diversity is greater. (D) PCA was used to determine the β-diversity of the samples. (E) Relative abundances of microbiota constituents at the class level. (F) Relative abundances of microbiota constituents at the genus level (n = 6).

