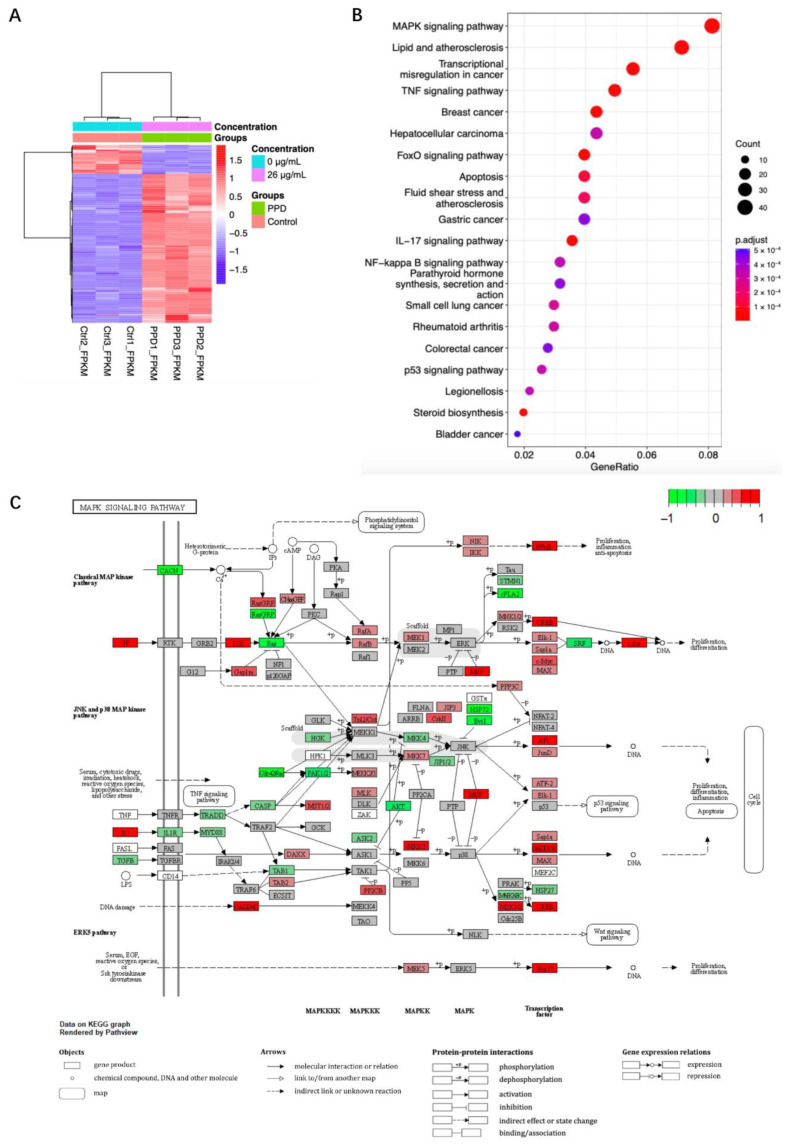
Figure 2.
Transcriptome sequencing analysis of PPD-treated NCI-H1299 cells. NCI-H1299 cells were treated with 26 μg/mL of PPD for 48 h followed by transcriptome sequencing analysis. (A): Heatmap of differentially expressed genes (DEGs). Colored bars indicate scaled fragments per kilobase million (FPKM) of transcript of each gene (red: High expression, blue: Low expression). Dendrograms represent similarities in clusters of samples (left) and in levels of gene expression (top). (B): Dot plot of enriched Kyoto Encyclopedia of Genes and Genomes (KEGG) pathways. Horizontal axis represents the ratio of DEGs annotated on certain pathway. The vertical axis represents the top 20 pathways with significant enrichment. (C): Integration and visualization of gene expression changes on the mitogen-activated protein kinases (MAPK) signaling pathway map. Red represents upregulated genes after normalization, and green represents downregulated genes after normalization.

