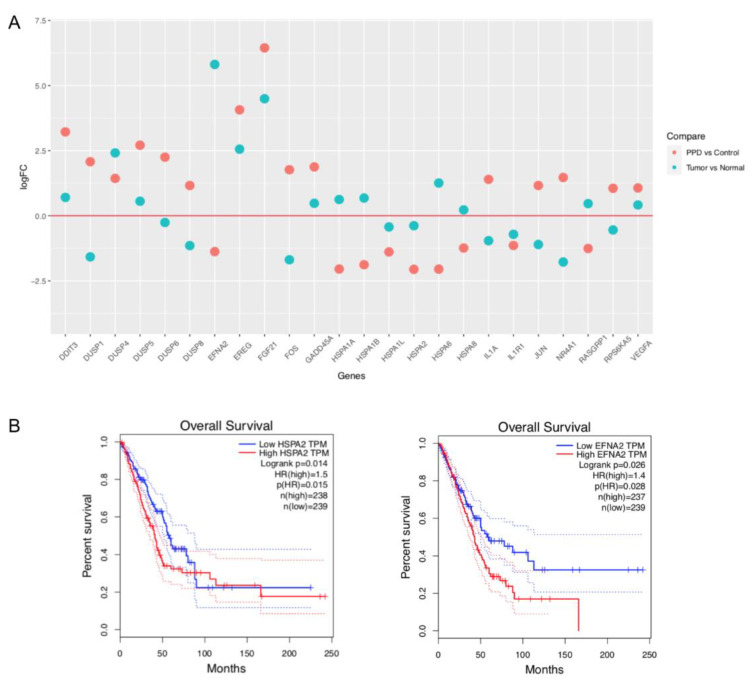
Figure 4.
Comparison of PPD-regulated DEGs with clinical data of lung adenocarcinoma patients. (A): Dot plot of mRNA expression of PPD-regulated DEGs in lung adenocarcinoma patients. The data of mRNA expression profiles of lung adenocarcinoma were downloaded from The Cancer Genome Atlas (TCGA) website, and the log2-fold changes (tumors vs. normal tissues) of gene expression were calculated through R package EdgeR [28]. (B): Survival plots of DEGs HSPA2 and EFNA2 in lung adenocarcinoma patients (through the website of Gene Expression Profiling Interactive Analysis).

