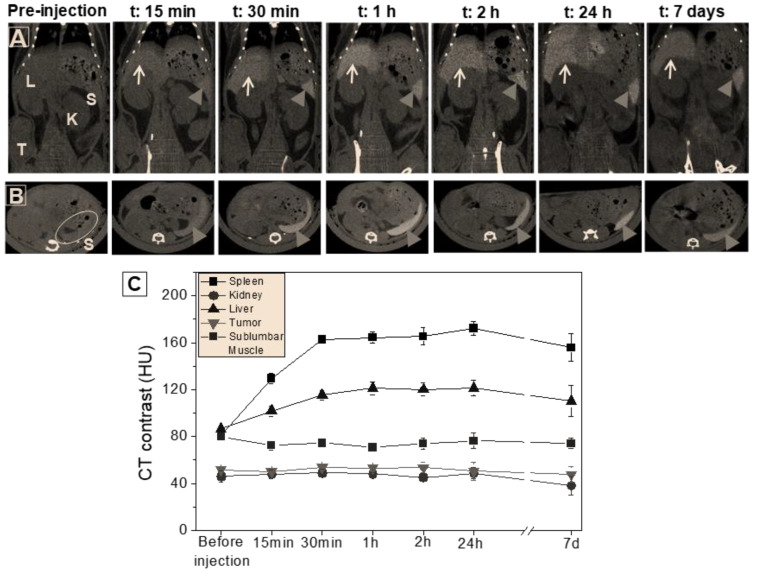
Figure 2.
In vivo CT analysis of intravenous injection via tail vein of CeO2NPs-MSA solution (200 μL, 10 mg Ce/mL) in mice, at various representative times from 0 h (before injection) up to 7 days. (A) Serial CT coronal views showing the main regions of interest, i.e., liver, spleen, kidneys, and tumour, are indicated with their initials in the first image. Arrowheads point at the spleen, and the white arrows indicate the liver. (B) Corresponding CT axial views show the contrasting evolution of the spleen over time. (Other white areas correspond to the bone, and black regions correspond to air). (C) Temporal evolution of CT contrast density values (HU) of the tissues under study. Numerical HU values are provided in Table S1.

