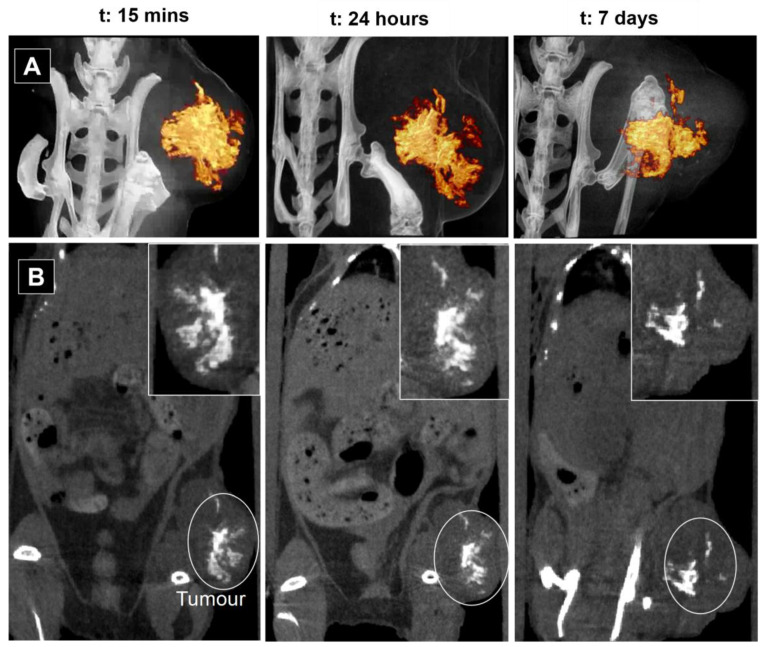
Figure 4.
In vivo CT images after intratumoral injection of 70 μL of CeO2NPs-MSA solution (10 mg Ce/mL) in mice at various time intervals: 15 min, 24 h and 7 days. (A) Snapshot of the 3D rendering videos (videos are provided in Figure S4). (B) Coronal view of a 2D CT projection. A zoomed image of the tumoral area is shown in the insight of each image.

