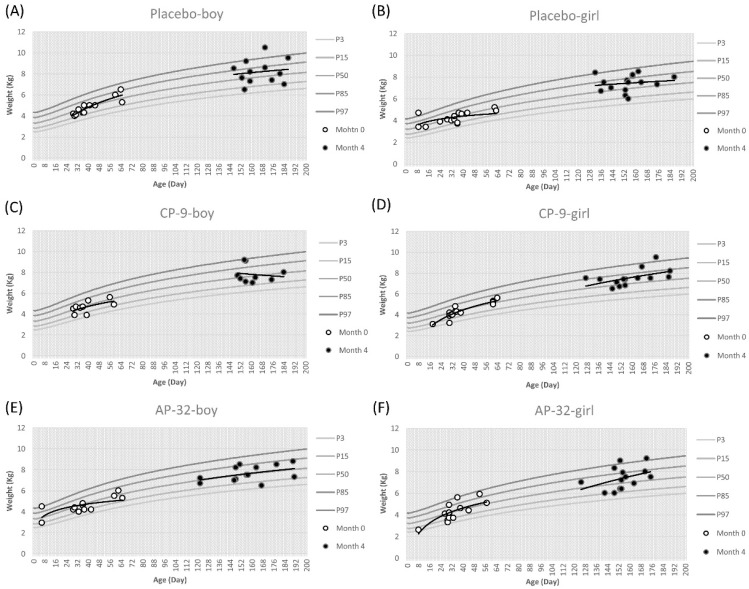
Figure 2.
Weight-for-age percentile curves for the mean of boys and girls of three treatment groups between 7 days and 2 months (60 ± 7 days) of age are represented with respect to the standard curves. Placebo group (A) boys and (B) girls. CP-9 group (C) boys and (D) girls. AP-32 group (E) boys and (F) girls. White dots represent the start of the trial at month 0, black dots represent the completion of the trial at month 4. The distribution trend of white dots or black dots is represented by a trend line.

