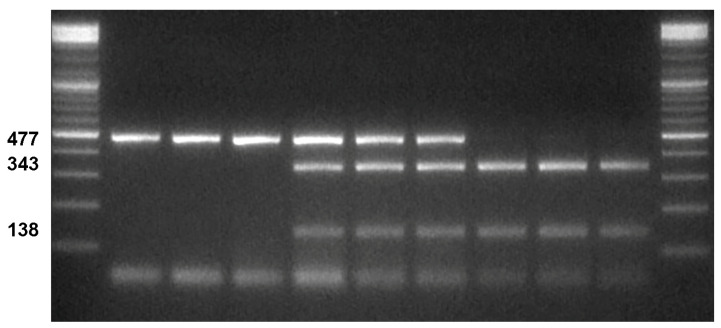
Figure 2.
Gel electrophoresis of the digestion products of Phyto. From left to right: ladder; three homozygote resistant genotypes (showing a single band of 477 bp); three heterozygote genotypes (showing the undigested band of 477 bp and the 343 and 138 bp bands, produced by the BtgI digestion of the 477 bp band); three susceptible homozygote genotypes (showing only the 343 and 138 bp bands); ladder.

