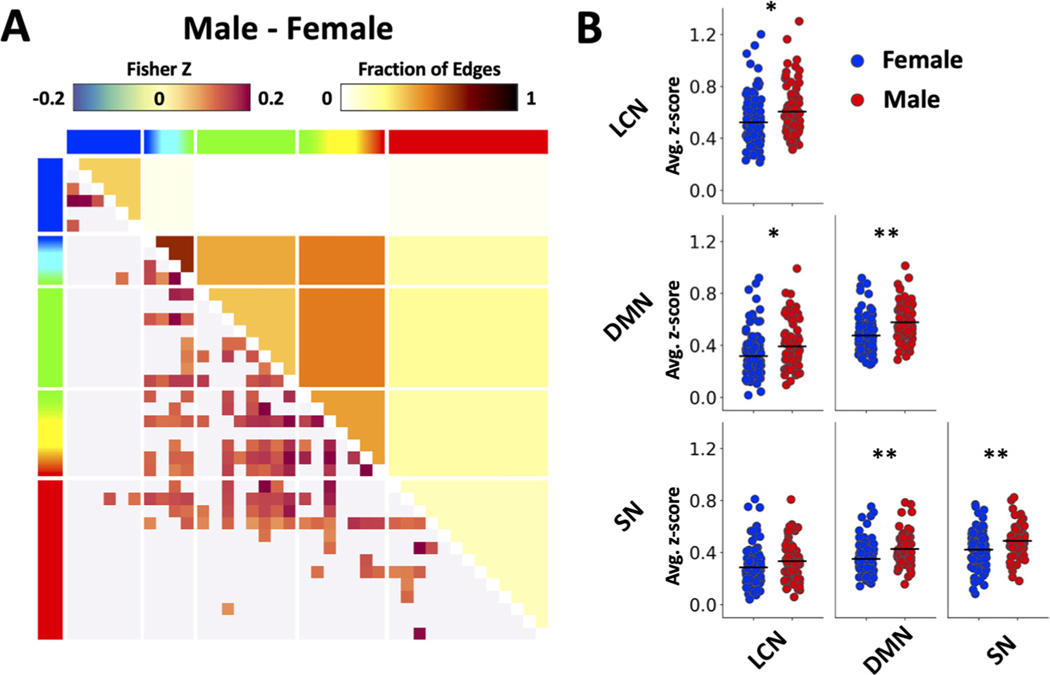
Fig. 2.
Sex effect on functional connectivity. (A) Main effect of sex on connectivity revealed by the GLM analysis. Note that the matrix shows significant differences in overall FC (collapsed across age, baseline and ethanol dosing) between male and female subjects. Functional connectivity (lower left) and fraction of significant edges (upper right) highlight statistically significant differences between sexes (p < 0.05). (B) Scatter plots showing sex differences in triple network functional connectivity. Results were generated using the baseline-only data recorded before alcohol injection. Functional connectivity values were averaged across regions within a specific network (* p < 0.05, ** p < 0.01).

