
Figure 5. Uric acid gene cluster is conserved across uric acid consuming gut bacteria.
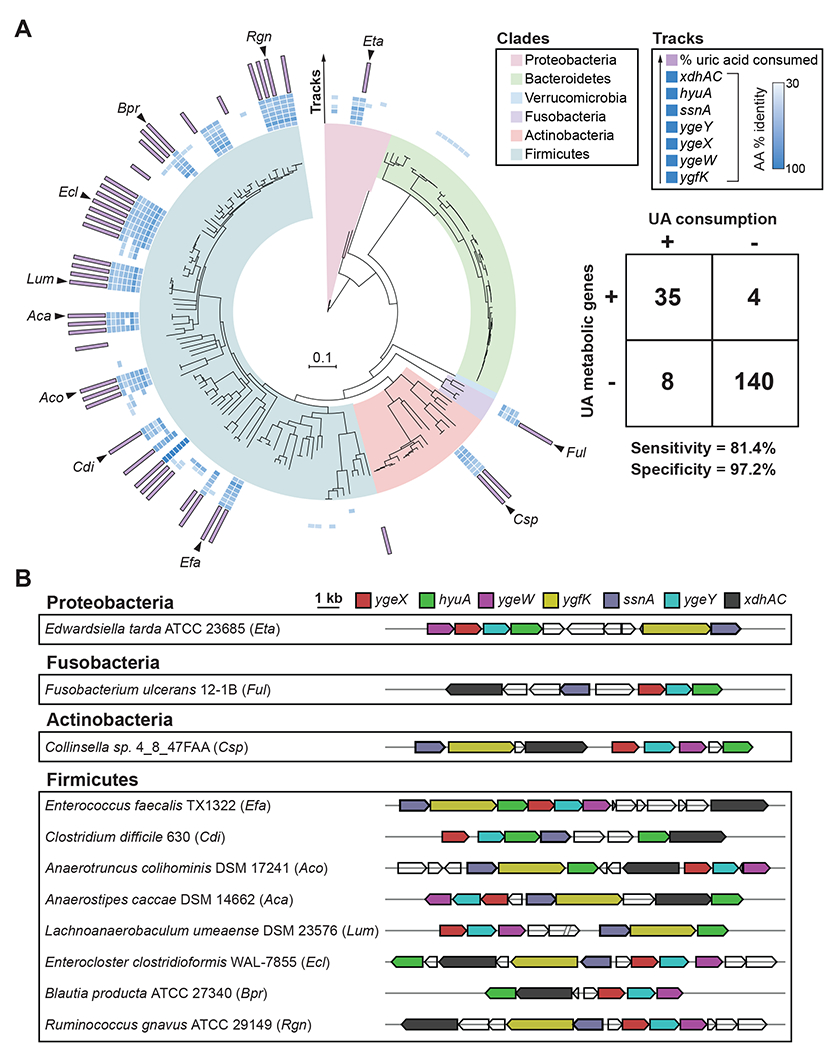
A) RpoB phylogenetic tree for strains screened for uric acid metabolism in this study. Only those strains with assembled genomes are included (n = 187). Clades are colored by phylum. Inner blue shaded tracks represent the % amino acid identity of protein homologs identified from BLASTp searches using C. sporogenes proteins as queries. The outer most track represents the % uric acid consumed by each strain. Uric acid consumption values are only shown for strains with ≥ 50% uric acid consumption. Table shows number of bacteria positive or negative for genes (cut-off ≥ 5 of 7 genes) vs. positive or negative for uric acid consumption (cut-off ≥ 50% uric acid consumption). The cut-off of ≥ 5 of 7 genes was determined by analyzing sensitivity and specificity at different gene cut-off values (Table S2). B) Genomic context of uric acid metabolic genes from representative uric acid consuming strains corresponding to black arrows in Figure 5A.