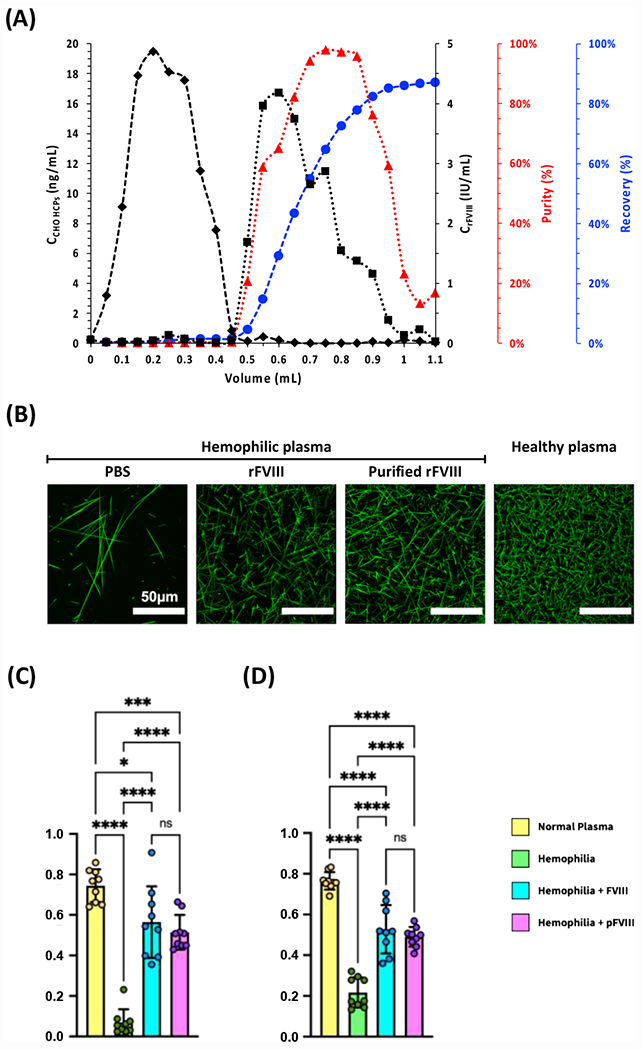
Figure 4. Photo-affinity chromatographic purification of rFVIII from using CAP.16”-ChemMatrix beads and blood clotting activity of purified rFVIII.

(A) Values of concentration of rFVIII (■) and CHO HCPs (◆);rFVIII purity (▲) and recovery (●) vs. volume of effluent collected from the measurement cell; the chromatographic operation was entirely conducted at room temperature (25°C) and under constant flow of 0.1 M HEPES buffer added with 5 mM CaCl2 and 0.01% v/v Tween20 at pH 7.4. (B) Clotting images generated by mixing platelet-poor plasma isolated from two Hemophilia A patients with aqueous 500 mM CaCl2, a solution of AF488-Fibrinogen at 50 μg·mL−1 in Binding Buffer, and either no FVIII or native FVIII, or FVIII purified via photo-affinity chromatography (fractions collected between 0.6 – 0.9 mL); clotting image generated by mixing healthy plasma with aqueous 500 mM CaCl2 and a solution of AF488-Fibrinogen at 50 μg·mL−1 in Binding Buffer. The images were generated from 5 μm z-stacks via confocal microscopy and the pixel density was measured in ImageJ. (C) Values of relative fiber density, calculated as the ratio of fiber pixels to background pixels after binarization of the images in panel (B). (D) Values of intersection density, calculated as the ratio of skeleton intersections post-erosion to the total number of fiber pixels pre-erosion of the images in panel (B). Plots show mean ± standard deviation. (**** p < 0.0001; two-way ANOVA).
