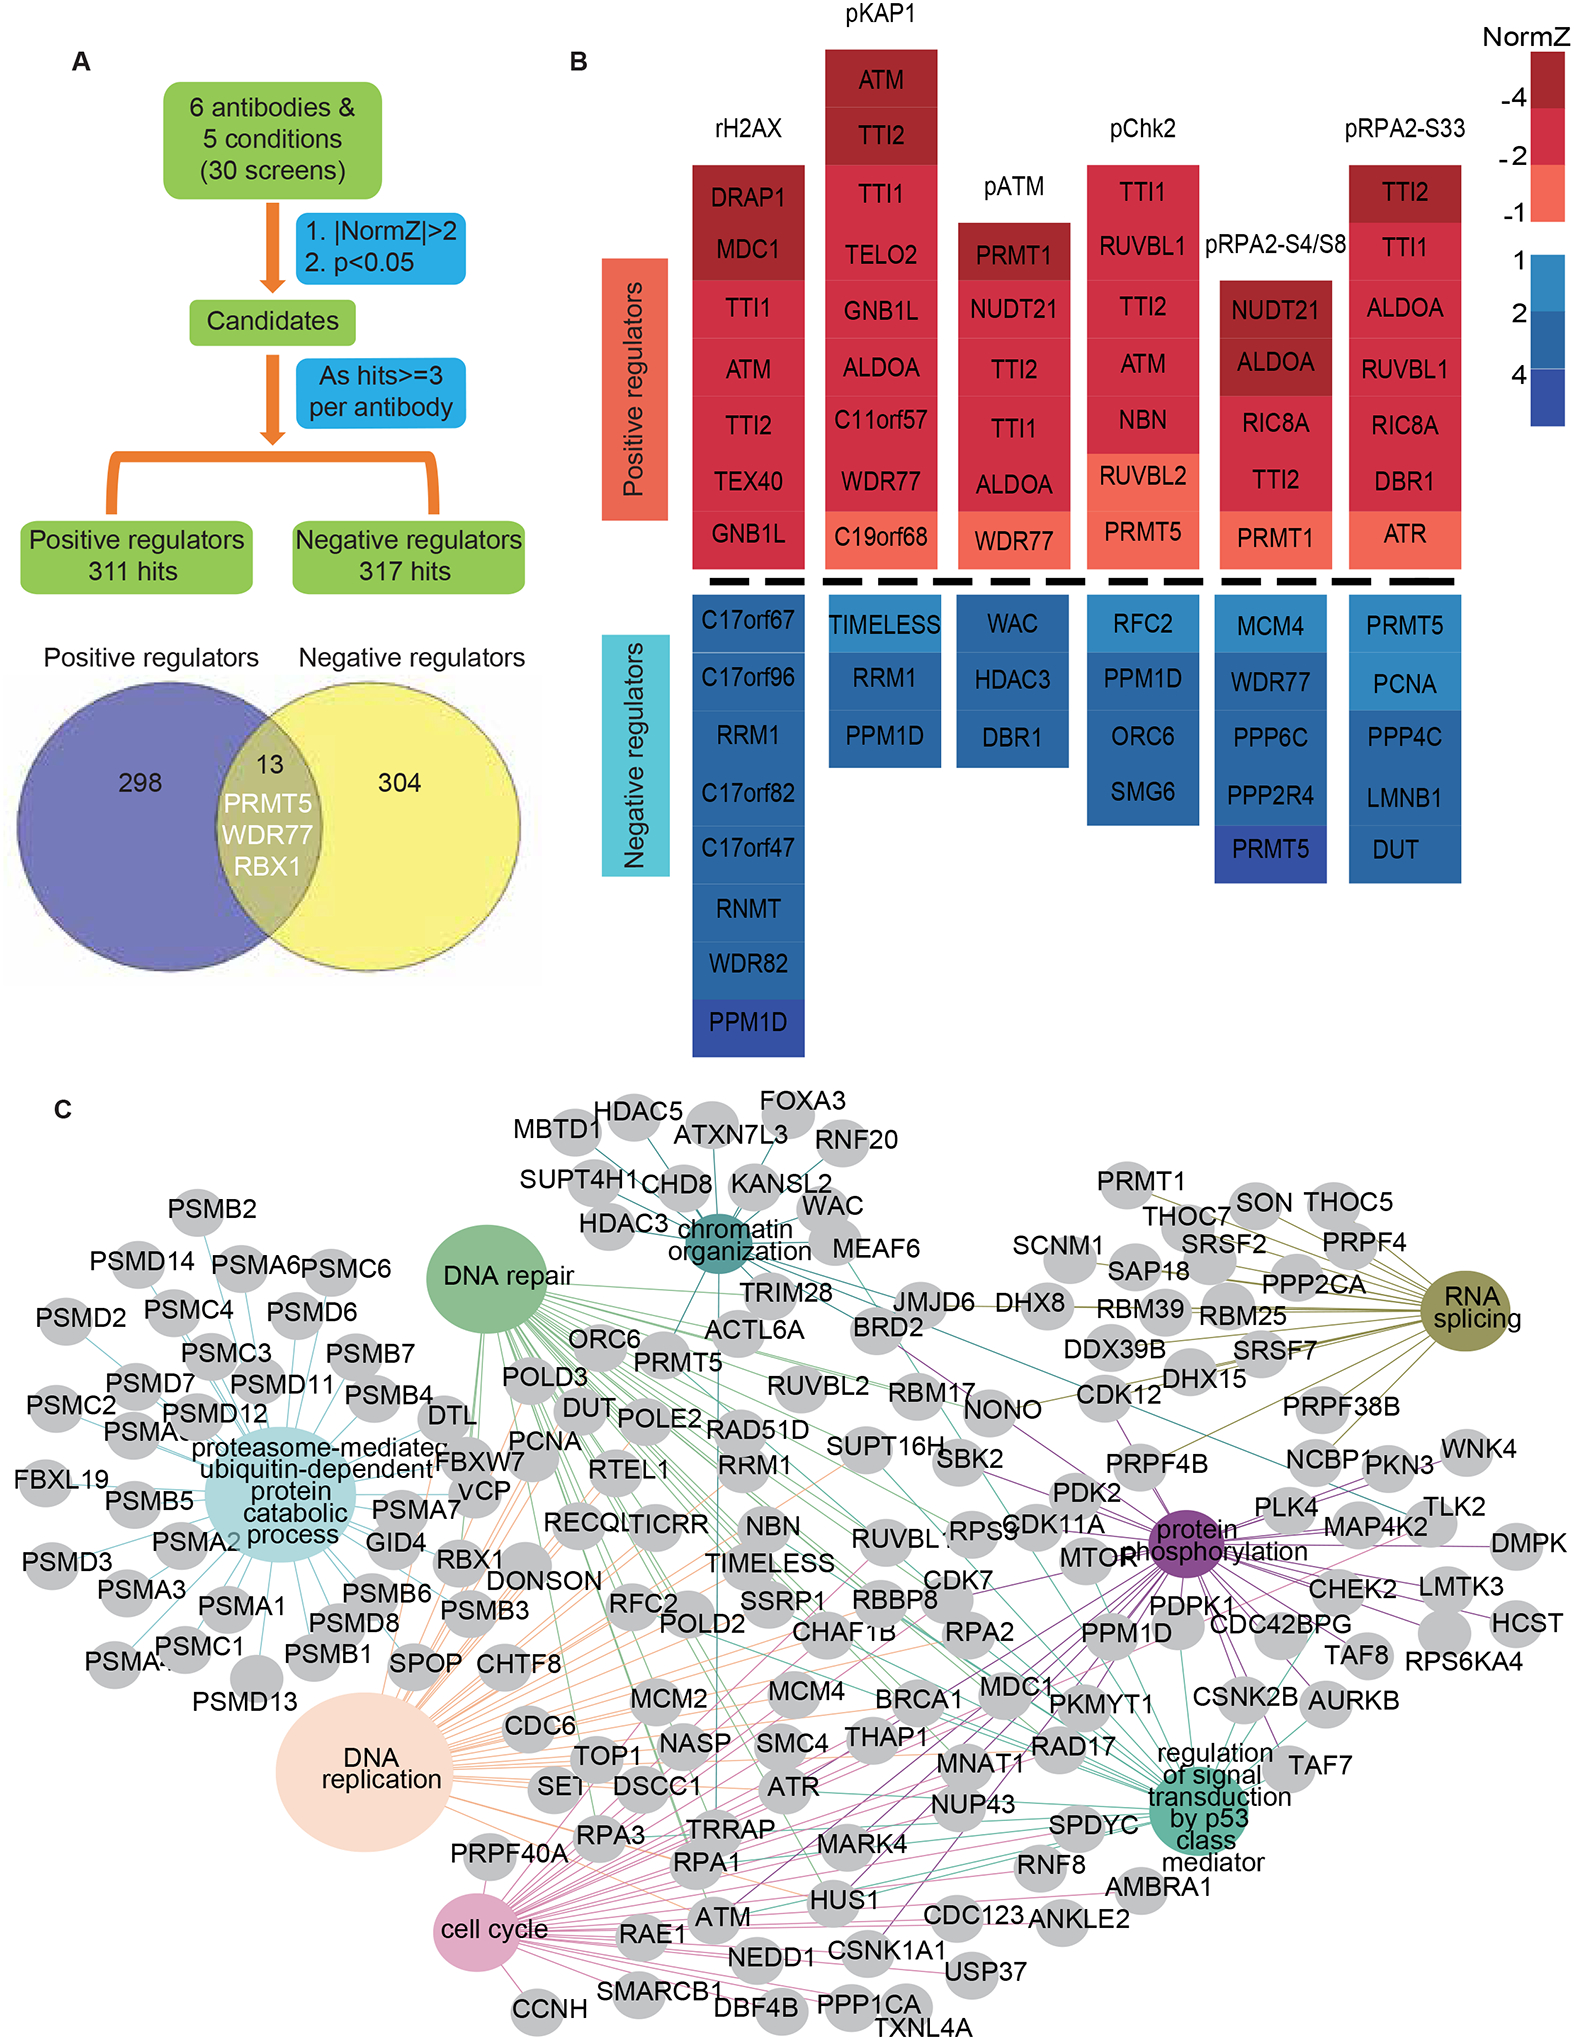
Figure 2. The regulatory network of DDR signaling revealed by antibody-based analyses.

(A) The criteria for analyzing positive and negative regulators of DDR signaling based on antibody.
(B) Heatmap plots show the normZ values of hub candidates. Red and blue colors represent positive and negative regulators, respectively. NormZ values were grouped by their absolute values labelled by different colors.
(C) Representation of the Reactome pathway network for the proteins in A. The pathways highlighted in color were significantly enriched. The GO term list is provided in Table S4.
