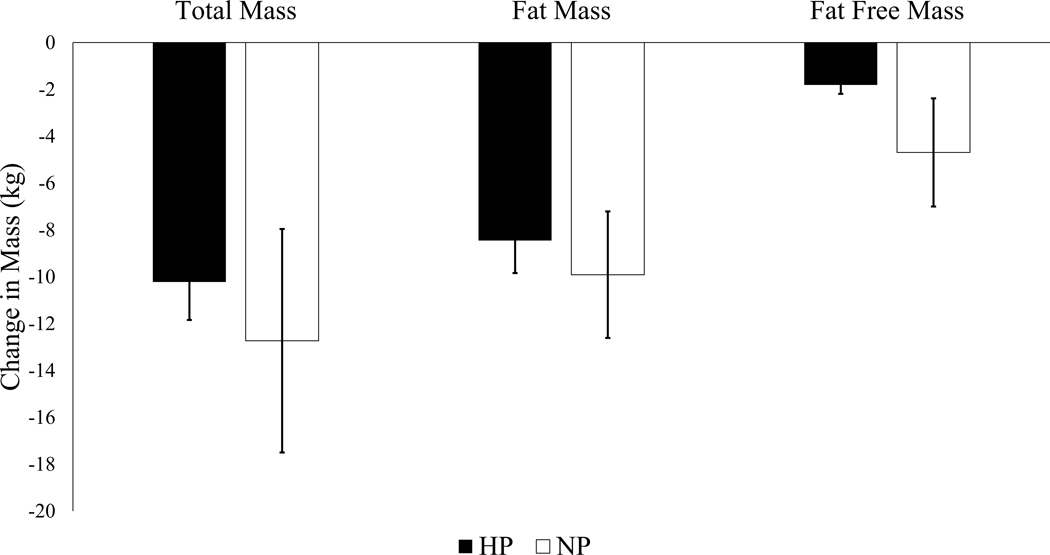
Figure 2. Change in Body Weight and Composition.
Depicts changes in weight and composition (fat and fat free mass) in kilograms from baseline to week 52 by diet group. Mixed effects models used to test the effect of diet group, time, and their interaction term on body weight and composition changes. Presented as LSMEANS±SE. Both groups had a significantly reduced weight (HP −10.2±1.6 kg; NP −12.5±1.6 kg), fat mass (HP −8.4±1.4 kg; NP −9.1±1.5 kg), and fat-free mass (HP −1.8±0.4 kg; NP −2.9±0.4 kg), but the majority of weight loss was due to fat mass loss. There were no differences in outcomes by diet group in changes in total mass (p=0.333), fat mass (p=0.735), or fat free mass p=0.056).

