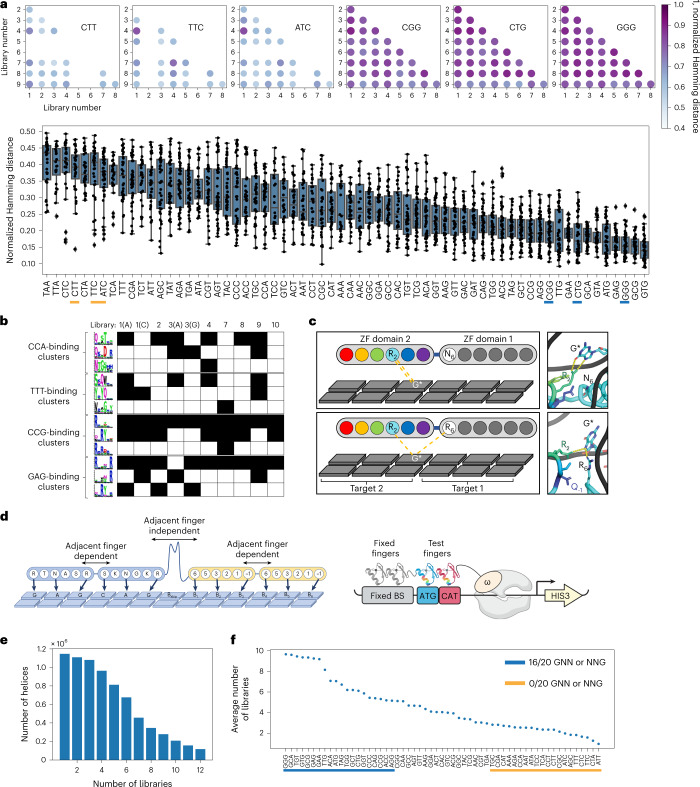
Fig. 2. Specificity solutions are library specific.
a, Top, dot plot comparison of 1 Hamming distance is provided comparing the similarity of helical strategies enriched in libraries 1–9 for three G-rich targets (right) and three G-poor targets (left). The darkness of the dot represents the similarity of the enriched populations, with darker dots being more similar. Empty spots indicate a failed target selection for one or both of the libraries compared. Bottom, normalized Hamming distance for all libraries across all targets, listed from least similar (left) to most similar (right). The targets compared above are underlined in yellow for G-poor targets and in blue for G-rich targets. b, Clusters were determined by MUSI from the enriched helices in each library selection. Three clusters are shown for four different binding sites (CCA, TTT, CCG and GAG). If a cluster was enriched in a library selection, the corresponding box is filled black in the table. c, Schematic illustration (top) and molecular dynamics snapshot (bottom) of hydrogen bonds between the arginine at position 2 of the domain 2 helix QsRYtt with the G* of the CCG* target when an asparagine is at position 6 of the adjacent finger (library 2 environment), or when an arginine is at position 6 of the adjacent finger (library 3, 9 environment). d, Left, paired format for two-finger selections using the base-skipping linker to encourage modularity, allowing test pairs (yellow) to function independently from the fixed pair (blue). Right, cartoon of B1H two-finger selections. e, The number of helices enriched in two-finger selections is shown as a factor of the number of single-finger libraries in which they originated. f, Comparison of helices enriched in the two-finger selections showing average number of single-finger libraries in which a helix originated, by binding site.

