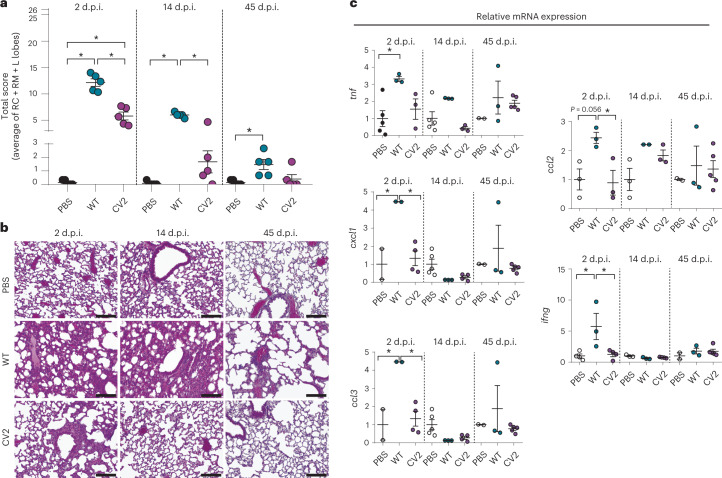
Fig. 1. Tissue lesions and inflammatory response of lungs infected with M. pneumoniae WT and CV2 strain.
CD1 mice (n = 5) were inoculated i.t. with M. pneumoniae CV2, WT or PBS (as control), and lungs were analyzed at 2, 14 and 45 d.p.i. a, Lung lesion evaluation, expressed as the total final score of the histological analysis performed on three major lobes. Each datapoint represents the average of the total score of the right cranial (RC), right middle (RM) and left lobes (L lobes). The mean values of each experimental group ± s.d. are indicated. *P < 0.05 by one-way ANOVA + Tukey’s multiple-comparison test. For a detailed description of the scoring system used in the histopathological analysis, see Methods. b, Representative H&E-stained lung sections (200×) from the left lobe. Scale bar, 100 µm. c, Gene expression of inflammatory markers, assessed by RT–qPCR. Data are shown as mean ± s.d. of 2−ΔΔCt. *P < 0.05 by one-way ANOVA + Tukey’s multiple-comparison test.

