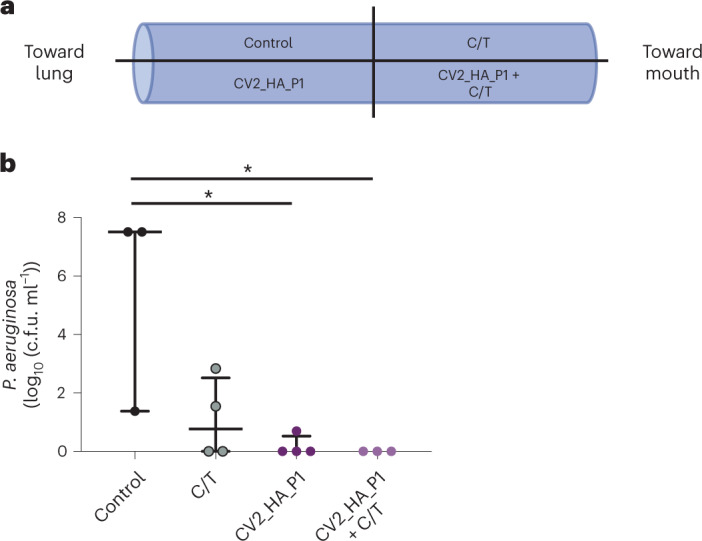
Fig. 4. Dispersion of biofilms of ETTs from patients with VAP.

a, Schematic representation of ETT slices from patients in the ICU who received MV. The 4-cm ETTs were taken from the distal part (for example, the first 10 cm closest to the patient’s lungs) and were sliced into four hemisections. One hemisection was used for each treatment arm: control (Hayflick medium alone without treatment), CV2_HA_P1 (~1 × 10⁸ cells), C/T (5 µg ml−1) or CV2_HA_P1 + C/T. b, Effect on the P. aeruginosa load on ETT biofilm from patients who received MV (see Methods). Significant differences between groups were found: P = 0.049 by two-sided Kruskal–Wallis test. The median and the IQR load (log10(c.f.u. ml−1)) of each treatment group were: (1) control (n = 3): 7.51 (4.44–7.51); (2) C/T (n = 4): 0.77 (0.00–2.52); (3) CV2_HA_P1 (n = 4): 0.00 (0.00–0.52); and (4) CV2_HA_P1 + C/T (n = 3): 0.00 (0.00–0.00). The P values for pairwise comparisons between groups (Wilcoxon’s signed-rank test) are indicated when significant (*P < 0.05). The level of significance for pairwise comparisons was P = 0.008.
