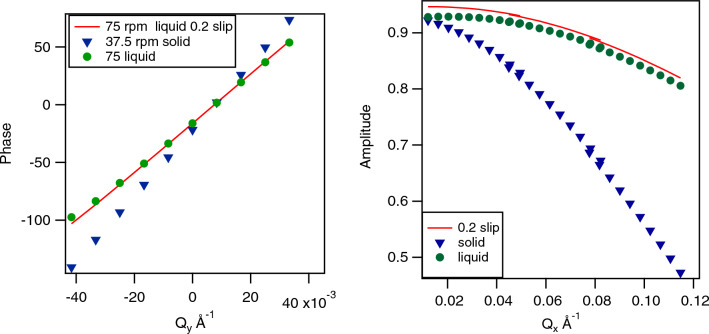
Figure 6.
Left panel: Numerically calculated phases as a function of vertical detector angle (along ) for a solid block using Eq. (13) and a speed of rotation of 37.5 rpm (triangles) and for a liquid sample using Eq. (19) at a cone rotation speed of 75 rpm, with a linear velocity profile, leading to the same average speed (circles). The solid line is for a liquid sample at 75 rpm using the same parameters but with a speed deviation of 20% at the shearing surfaces, simulating massive symmetric slip. Right panel: Numerically calculated amplitudes as a function of horizontal scattering angle, along , for the same velocity distributions.

