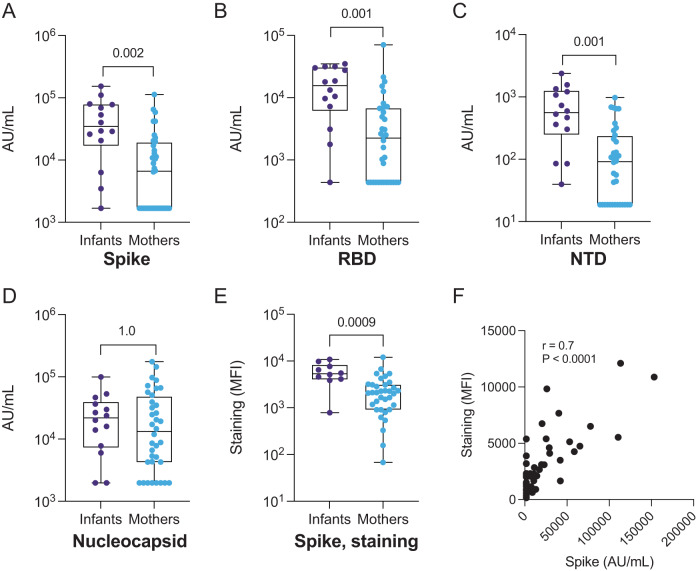
Fig. 1. IgG binding to SARS-CoV-2 antigens and S-CEM cell surface staining in SARS-CoV-2-seropositive infants and mothers.
IgG antibody binding titers to A full-length Spike, B RBD, C NTD, and D nucleocapsid in convalescent plasma from infants (purple, N = 14) and mothers (blue, N = 35) measured by commercial multiplexed electrochemiluminescent assay (MSD). E Antibody binding to Spike expressed on the CEM cell surface in infants (purple, N = 10) and mothers (blue, N = 35). The Spike staining was repeated in triplicate. F Spearman correlation coefficient and p value (p = 2.5 × 10⁻⁷) calculated for Spike IgG binding by MSD assay versus S-CEM cell surface staining. Box plots show the median center line and 25/75 percentiles. Whiskers show min and max values. P values are indicated above comparisons. Two-tailed Wilcoxon rank-sum test was used for all comparisons. MFI mean fluorescence intensity, AU/mL arbitrary units/milliliter.

