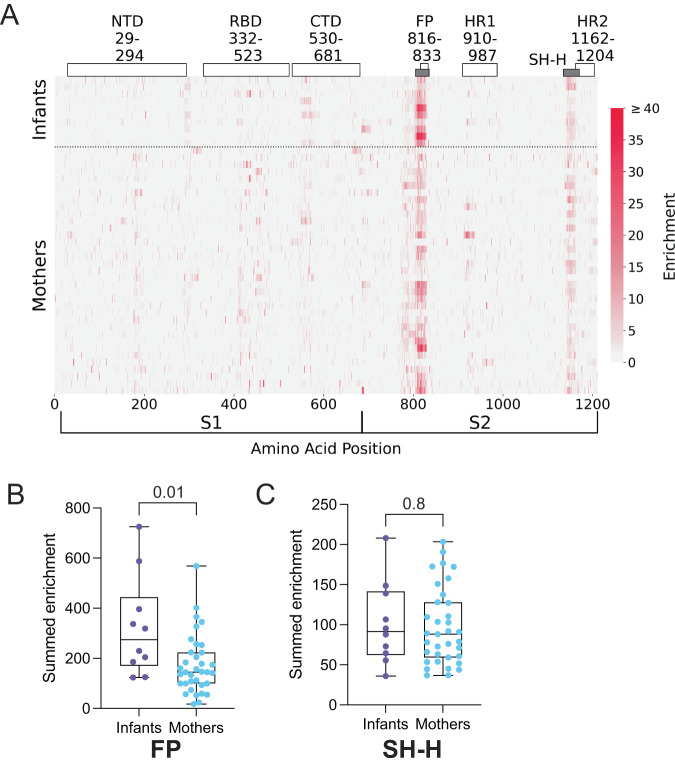
Fig. 2. Enrichment of plasma antibodies bound to wild-type Spike peptides.
A Heatmap depicting peptide-bound, enriched antibody responses for individual infants (N = 10) and mothers (N = 35) (rows). Spike subdomains and amino acid ranges are labeled at the top. Gray bars indicate epitopes of focus in this study (FP and SH-H). Spike amino acid positions and S1 and S2 subunits are indicated at the bottom x-axis. The enrichment scale is indicated on the right. Summed antibody enrichment among mothers (blue, N = 35) and infants (purple, N = 10) in the FP epitope (B) and SH-H epitope (C). Box plots show the median center line and 25/75 percentiles. Whiskers show min and max values. P values are indicated above comparisons. Two-tailed Wilcoxon rank-sum test was used for both comparisons. NTD n-terminal domain, RBD receptor binding domain, CTD c-terminal domain, FP fusion peptide, HR1 heptad repeat 1, SH-H stem helix-heptad repeat 2, HR2 heptad repeat 2.

