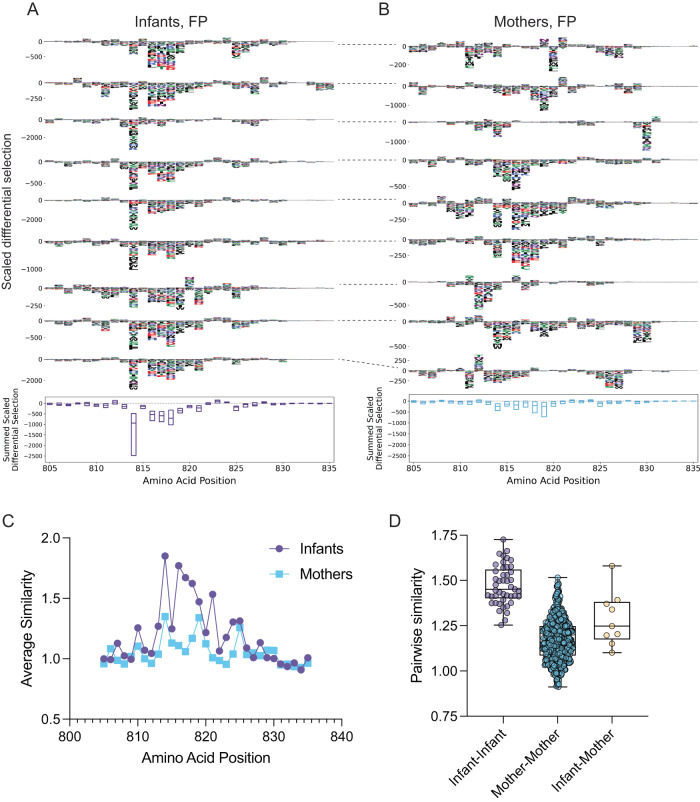
Fig. 3. Mutations that confer antibody binding escape in the Spike FP, and similarity in escape profiles.
A Individual infant (N = 10) escape profiles in the FP region (top), summed scaled differential selection at each position across all infant profiles (bottom). B Individual mother (N = 35) escape profiles in FP region (top), summed scaled differential selection at each amino acid position across all mother profiles (bottom). Dashed lines connecting escape profiles in (A) and B signify mother-infant pairs. C Average similarity score at each FP amino acid position for infants (purple) and mothers (blue). D Pairwise similarity scores across FP region among infants (purple, N = 45 infant-infant pairs), among mothers (blue, N = 595 mother-mother pairs), and for infant-mother pairs (yellow, N = 9 pairs). Summed scaled differential selection values for mothers (B, bottom panel) include data from all mothers (see additional logo plots in Fig. S5). Box plots show the median center line and 25/75 percentiles. Whiskers show min and max values.

