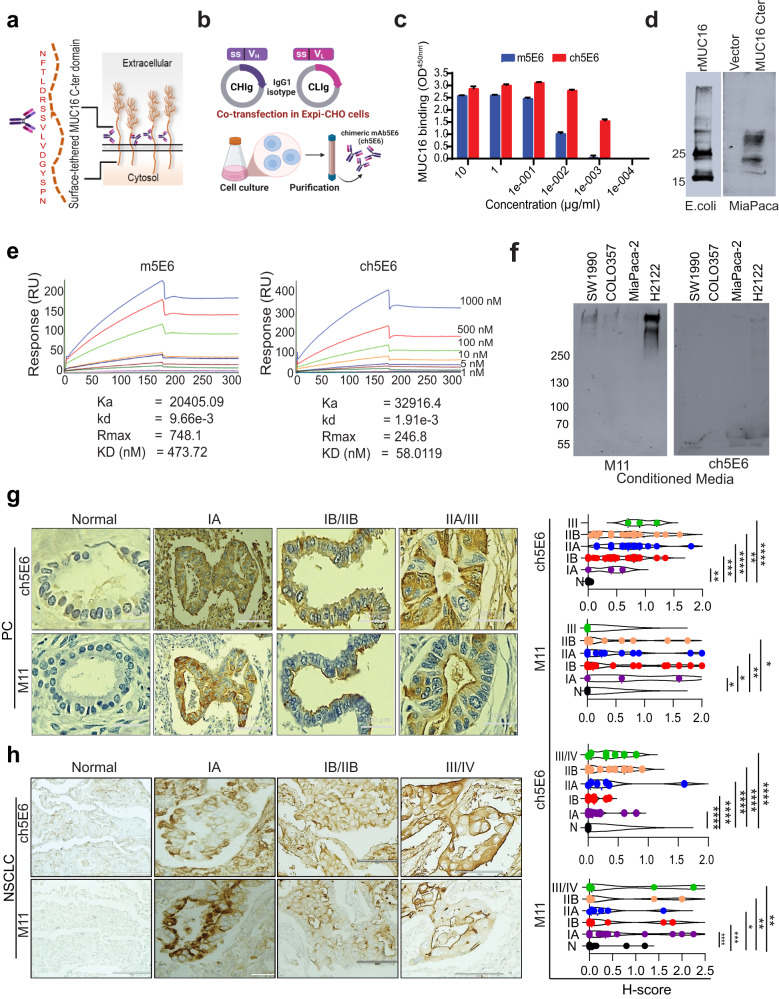
Fig. 1. Generation and characterization of chimeric mAb5E6 (ch5E6) binding in patient tumors.
a Graphical representation of mAb5E6 epitope on surface tethered carboxy-terminal (Cter) domain of MUC16. b Schematic representation of ch5E6 generation by grafting murine VH and VL regions on human IgG1 FcH and FcL harboring plasmids and co-transfecting in ExpiCHO cells. c ELISA for binding of chimeric mb5E6 to recombinant MUC16 C-ter protein (rMUC16-Cter) and its comparison to parent murine version mAb5E6.Y-axis, binding as absorbance measurement at 450 nm; X-axis, mAb concentrations; d Immunoblot analysis of ch5E6 with E.coli expressed, and MIA PaCa-2 cells transfected rMUC16-C ter protein lysates. e Real-time binding analysis of anti-MUC16 murine (m5E6) and chimeric mAb5E6 (ch5E6) to rMUC16-Cter protein using SPR (Surface Plasmon Resonance). Different concentrations of rMUC16-Cter from 0 nm to 1 µM were passed over the immobilized chimeric and murine mAb5E6 on sensor chip CMD200m. Ka and Kd values were obtained by the analysis of sensograms on scrubber 2.0 and were used to calculate KD values. Y-axis, amount of bound antibody as resonance units (RU); X-axis, time in seconds. f Immunoblot analysis of conditioned media (CM) prepared from MUC16 expressing PC SW1990, COLO357, and NSCLC H2122 cell lines for determining the binding of ch5E6 to shed from MUC16. Soluble MUC16-specific mAb M11 was used as the positive control, and MIA PaCa-2 cell line-derived CM was used as a negative control. The lysates (40 μg) prepared from these cells were loaded on 6% and probed with both M11 and ch5E6. g, h Immunohistochemical analysis of ch5E6 with MUC16 on tissue microarray (TMA) from patient tumors at various stages of PC (Stage IA; n = 3, IB; n = 32, IIA; n = 16, IIB; n = 14, III; n = 3) and NSCLC (Stage IA; n = 14, IB; n = 10, IIA; n = 6, IIB; n = 11, III; n = 6) and normal adjacent tissues (PC; n = 8, NSCLC; n = 30). Staining with mAb M11 was used to evaluate MUC16 expression in the tissues. A pathologist at UNMC scored the slides. A histoscore (H-score) was calculated by multiplying intensity and positivity. Representative images of ch5E6 binding to different disease stages are shown in parallel. Error bars in 1C indicate SD. Scale bars, 100 µm; *P < 0.05; **P < 0.01, ****P < 0.001. Fig. 1a was “created with Biorender.com”.

