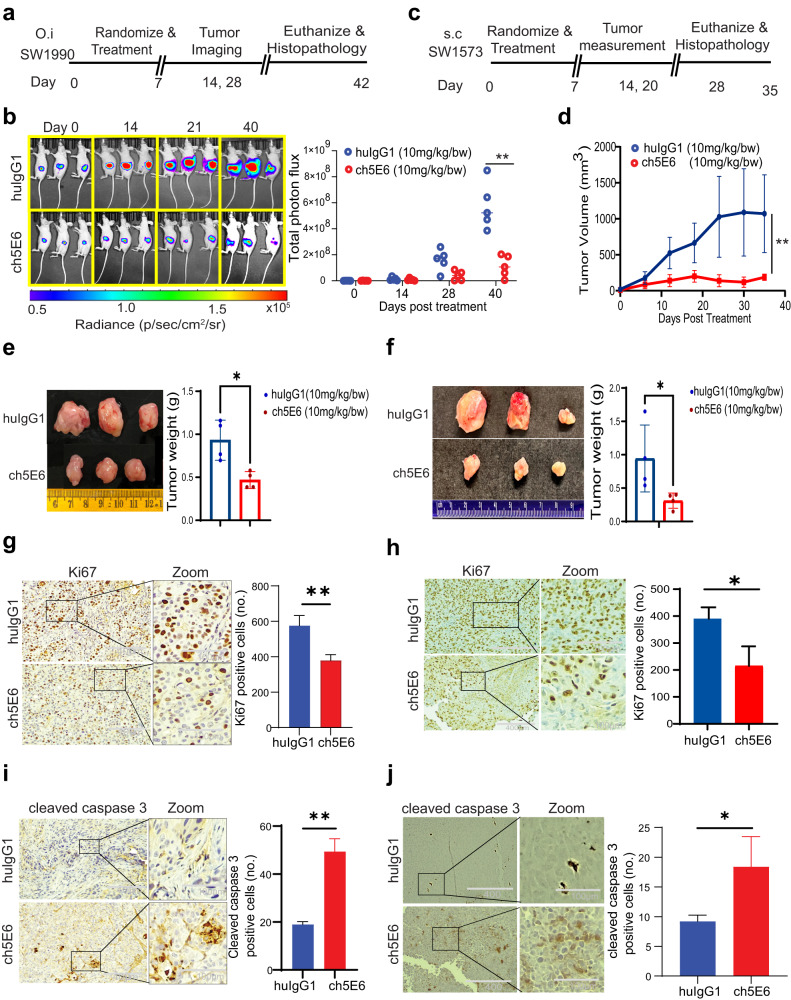
Fig. 5. ch5E6 induces potent anti-tumor activity in pancreatic and lung tumor-bearing mice.
a Experimental schema and treatment strategy for testing the efficacy of ch5E6 in orthotopic xenografts developed from luciferase labeled SW1990 PC cells. The antibody regimens ch5E6 and huIgG1 were administered i.v. following twice weekly schedule at 10 mg/kg doses for 40 days. b Representation of IVIS imaging for measuring the bioluminescence (BLI) over various time points during the experiment. The graph shows a change in tumor volumes measured as total photon flux in ch5E6 treated animal groups (red dots) compared to respective isotype control mAb huIgG1 (blue dots). c Strategic plan for testing the efficacy of ch5E6 in subcutaneous xenografts developed from SW1573 NSCLC cells. The doses and schedules were similar as followed in PC model. d The line graph shows a change in tumor volume in the ch5E6 treated group than huIgG1 treatment. Length, width, and height were measured every 3rd day throughout the treatment schedule. The formula for measuring tumor volume = (length × height × width) *0.5). The pictorial and quantitative representation of orthotopic PC (e) and subcutaneous NSCLC tumors (f) excised at the end of the study. Immunohistochemical analysis and quantitative data showing the changes in proliferation index as ki67 staining in PC (g) and NSCLC (h) tumors. Apoptosis as cleaved caspase 3 expression in SW1990 (i) and SW1573 (j) tumors treated with ch5E6 compared to huIgG1 control group. ImageJ was used to count the stained cells. (n = 3–5 fields/tissue; three animals). Error bars indicate SEM. Scale bar, 400 μm; magnified images, 100 μm; *P < 0.05; **P < 0.01.

