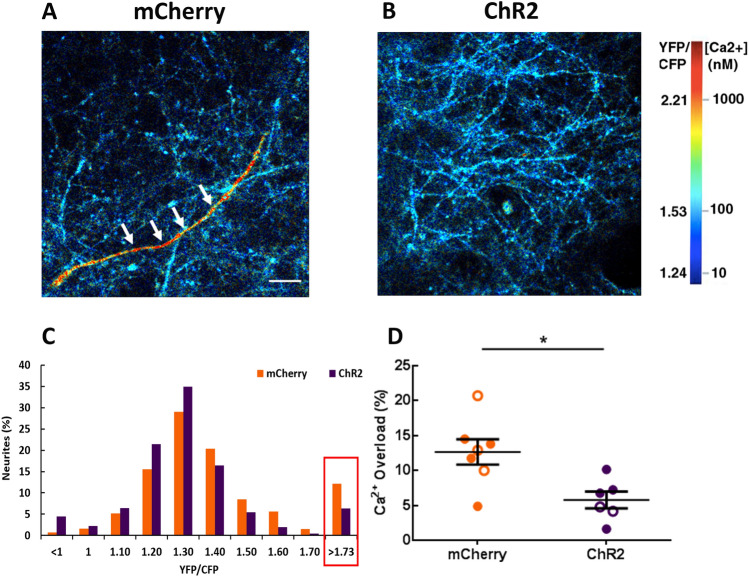
Figure 4.
Optogenetic rescue normalizes neuronal calcium in APP mice. (A, B) The images pseudocolored according to the intraneuronal calcium concentration, acquired from APP mice expressing mCherry (A) or ChR2 (B). A neuronal process exhibiting calcium overload is seen in red (white arrows). (C) Histogram showing the distribution of YFP/CFP ratios in neurites expressing YC 3.6. Neuronal calcium overload was defined as a YFP/CFP ratio larger than 2 standard deviations above the average YFP/CFP ratio in the neurons of NTG mice. The ratio of YFP/CFP > 1.73 was considered as calcium overload. (D) The percentage of neurites exhibiting calcium overload after 2–4 week light activation of astrocytes. Values are mean ± SEM. Males are represented by closed circles and females by open circles. Scale bar, 100 μm, *p < 0.05.

