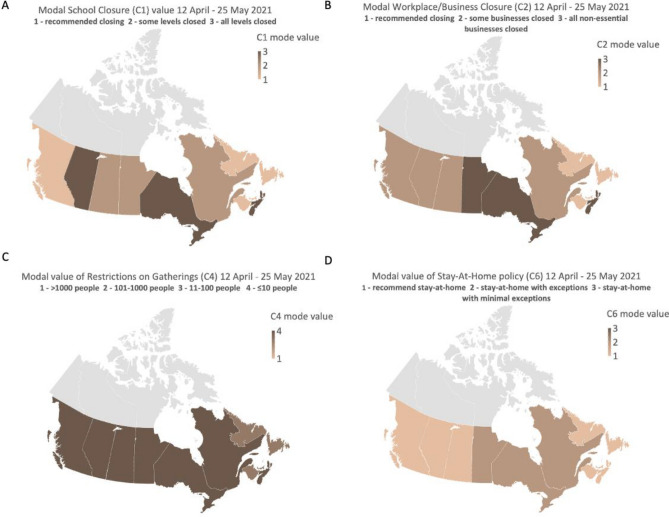
Figure 2.
A graphical representation of the variation in government-mandated public health measures across all Canadian provinces. The maps show the most frequently occurring (mode) restriction level for school closures (Panel A), workplace/business closures (Panel B), restrictions on gatherings (Panel C) and stay at home orders (Panel D) during the survey sampling period (April 12–May 25, 2021). The Territories of Canada were not included in CPENS due to low populations density. (Map created using OxCGRT data in Excel for Microsoft 365 v.16).

