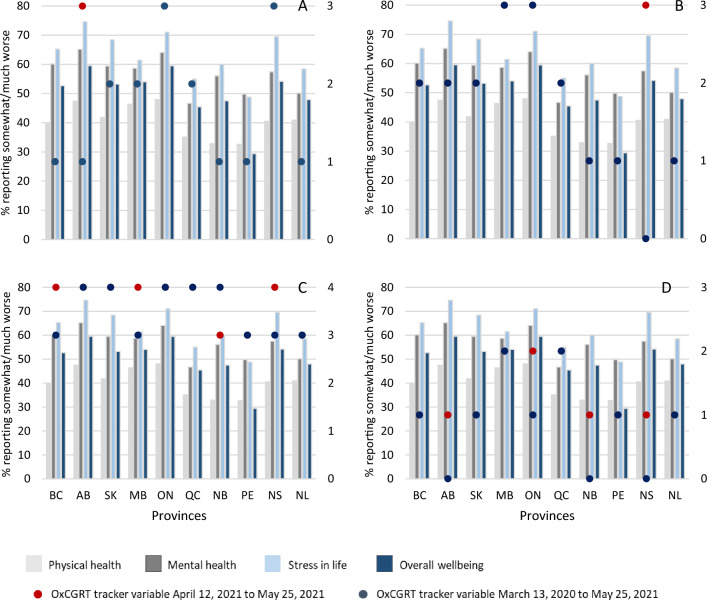
Figure 5.
Reported impact of COVID-19 on health-related outcomes with (Panel A): school closures, (Panel B): business/workplace closures, (Panel C): restrictions on gatherings and (Panel D): stay-at-home orders. Bars represent the prevalence of people who reported feeling “somewhat/much worse” in each of the COVID-19 health related outcomes. Where only one dot is visible, the restrictions of the two periods are the same or similar. Right axis corresponds to the ratings of the OxCGRT variables. BC—British Columbia, AB—Alberta, SK—Saskatchewan, MB—Manitoba, ON—Ontario, QC—Quebec, NB—New Brunswick, PE—Prince Edward Island, NS—Nova Scotia, NL—Newfoundland and Labrador.

