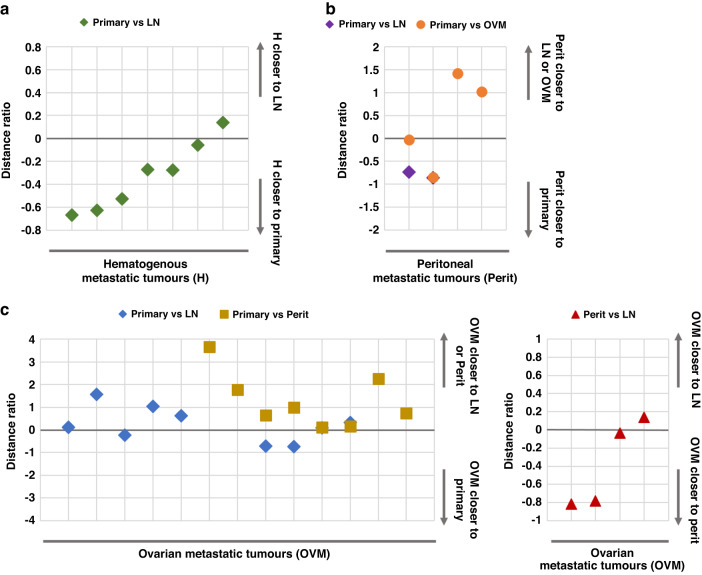
Fig. 3. Genomic distances among the primary and metastatic tumors based on their routes in the paired samples.
The distance ratio was calculated as d(A to B)/d(A to C)-1. A distance ratio > and < 0 indicates that A is genomically closer to C and B, respectively. a Distance ratio plot showing that hematogenous metastasis (H) was closer to the primary tumor when compared to lymph node (LN) metastasis. b The genomic distance of peritoneal metastasis (perit) when compared to LN and ovarian metastasis (OVM) showed peritoneal metastasis to be closer to the primary tumor than LN metastasis. c Genomic distance analysis of the OVM to the primary, LN, and peritoneal metastasis showed that OVM is genomically closer to LN or peritoneal metastasis when compared to the primary tumor (left), and closer to the peritoneal when compared to LN metastasis (right).

