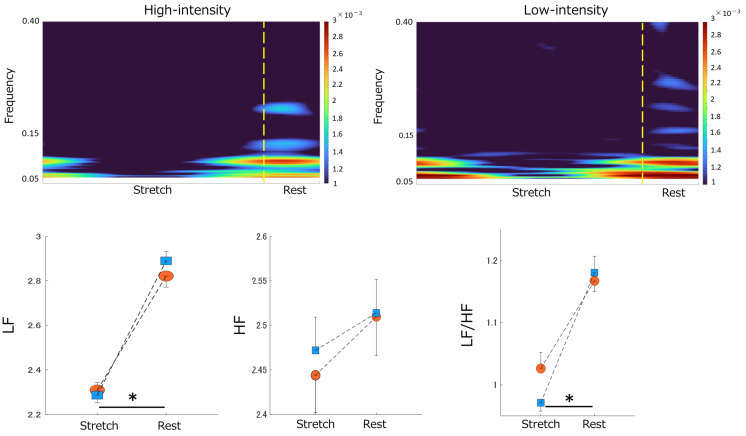
Figure 4.
Stretching−elicited time-frequency responses to ANS activity by differences in stretching intensity. Top panel: The color scale represents the power magnitude relative to the difference in phase factor (Stretch/Rest). The left panel indicates the time-frequency response to High−intensity stretching. The right panel displays the time−frequency response to Low−intensity stretching. Bottom panel: The effect of differences in stretching intensity on the magnitude of the LF power (bottom left), HF power (bottom center), and LF/HF ratio (bottom right) by differences in phase factor. Blue squares indicate Low−intensity stretching conditions. Orange circles indicate High−intensity stretching conditions. “*” indicates a significant difference between the stretch and rest phases (p < 0.05). Data are mean ± SEM. ANS, Autonomic Nervous System; LF, Low Frequency; HF, High Frequency.

