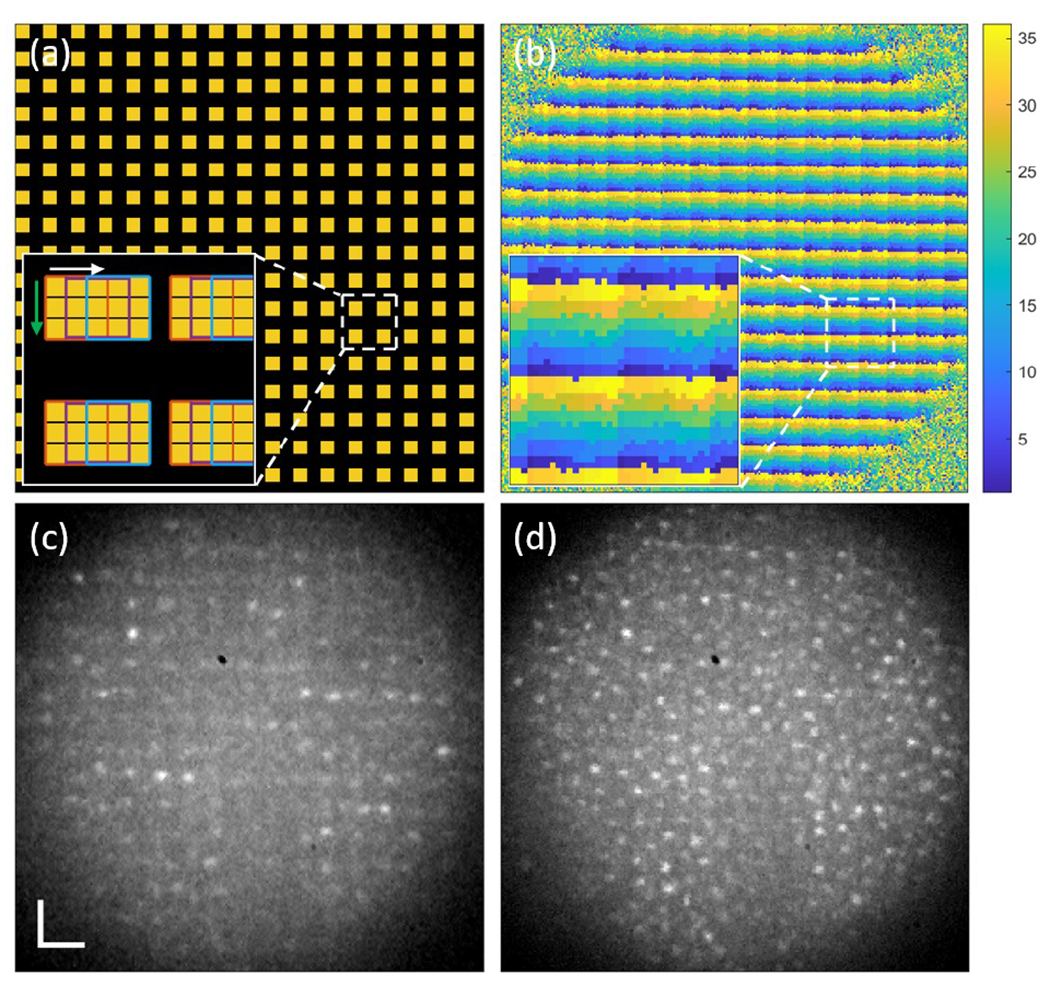
Fig. 2.

(a) A multi-spot illumination pattern with a fill factor of 0.25. The yellow squares indicate the illuminated spots. The inset shows enlarged illumination spots consisting of 3 by 3 DMD mirrors and being scanned horizontally and then vertically with a 1 DMD mirror step size. (b) A spatial filtering mask used for composite image reconstruction. Each pixel is labeled as a number between 1 and 36 (the number of subframes), here shown as colors. (c) A single subframe retinal image of N1 at 6° TR. (d) A single reconstructed retinal image from (c) and the other 35 subframes. The scale bar is 20 μm.
