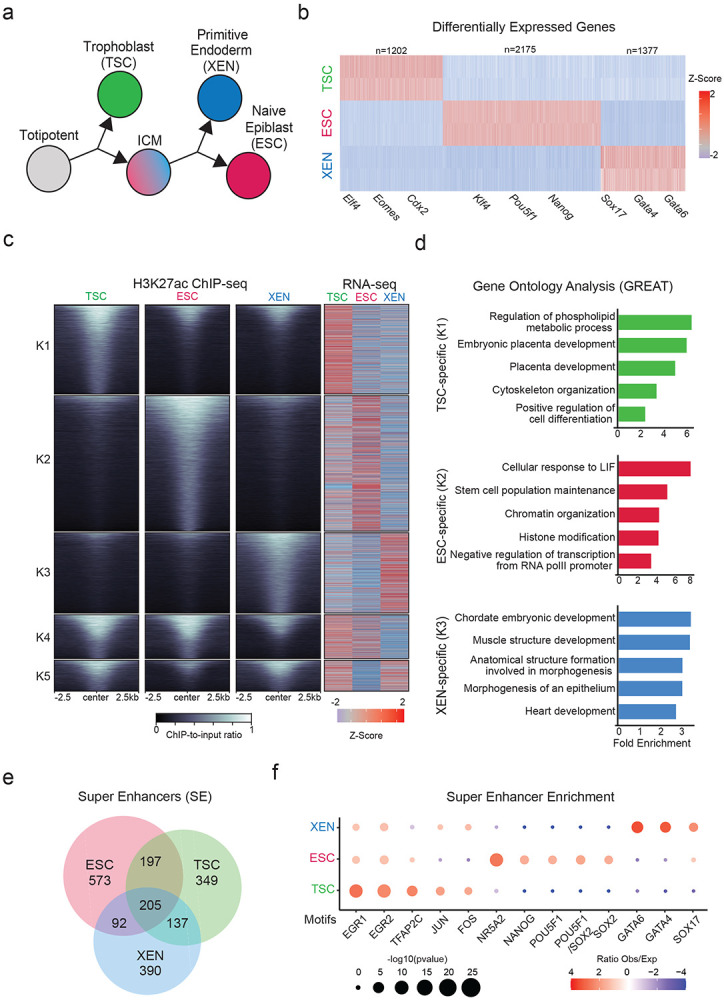
Figure 1. Transcriptional changes and enhancer remodeling accompany early developmental decisions.

a. Schematic illustration depicting the experimental cell lines used to model early developmental fate decisions.
b. Heatmap showing TSC, ESC and XEN signature genes, which are significantly upregulated in the respective cell line compared to the other two lineages (TPM>1, LogFC >2 and p-adjusted <0.01). Scale represents Z-score of normalized RNA-seq counts. RNA-seq was performed in two independent replicates for each sample. Examples of known regulators and markers of each lineage are highlighted on the bottom. For further details see also Extended Data Fig. 1
c. Tornado plot (left) illustrating H3K27ac ChIP-seq signal for TSC, ESC and XEN around different clusters of peaks (+/−2.5 kb), as defined by K-means clustering (K=5) using an atlas of all H3K27ac peaks across cell lines. Scale bars denote normalized H3K27ac ChIP-seq signal over input. Heatmap (right) illustrates Z-score normalized RNA-seq levels of most proximal genes corresponding to each of the H3K27 peaks. For further details see also Supplementary Table 2.
d. Gene ontology analysis (using the GREAT software) of cell type specific enhancers as identified by K-means clustering shown in (1B). Significance was calculated with the two-sided binomial test and “Region Fold Enrichment” is presented on the x-axis for selected significant (padj-value<0.05) biological processes shown in the graph. For further details see also Supplementary Table 3.
e. Venn-diagram showing degree of overlap among Super Enhancers (SE) in TSC, ESC and XEN cell lines, as called by the ROSE algorithm using H3K27ac peaks as input. For further details see also Supplementary Table 2.
f. Relative enrichment of TF binding motifs found in cell-type specific SE. The enrichment plots depict selected significant motifs with −log10(p-value) higher in one cell type versus the other two. Size of dots indicates the p-value (two-sided Fisher’s exact test) while color indicates the ratio of observed versus expected frequency. For further details see also Supplementary Table 3.
Note: all statistics are provided in Supplementary Table 9.
