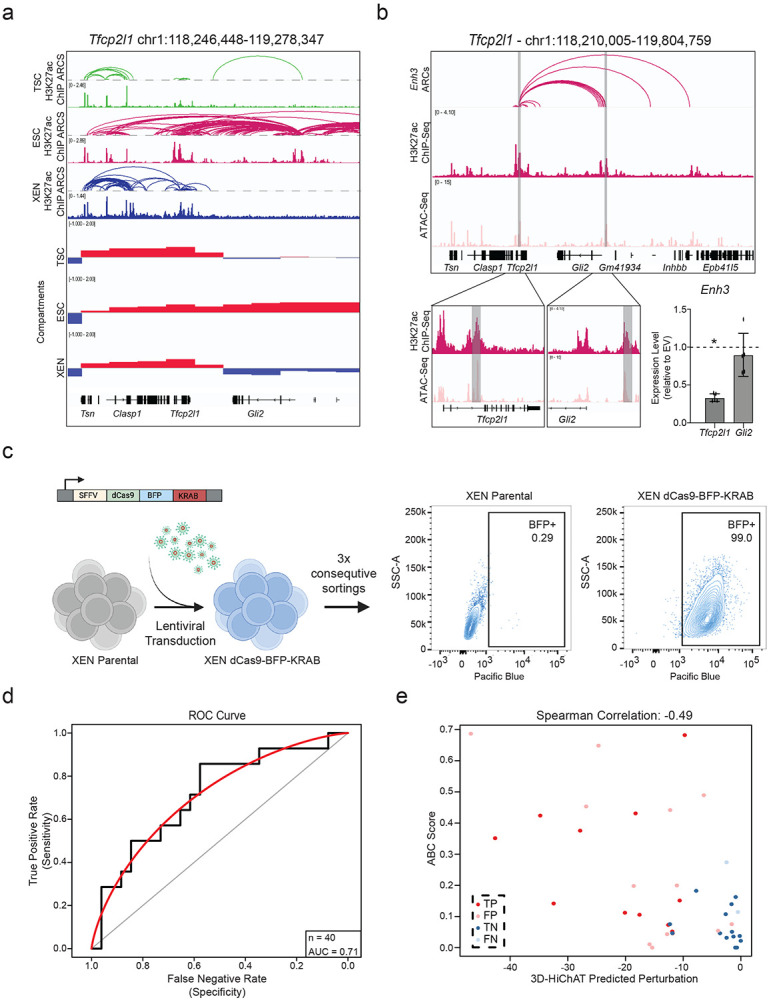
Extended Data Fig. 6.

Related to Figure 6
a. Visualization of the Tfcp2l1 Locus showing H3K27ac HiChIP arcs, H3K27ac ChIP and Compartment c-scores called by HiC for TSC, ESC, and XEN. Notably, a group of putative enhancers upstream of Gli2 are uniquely expressed and only in an A compartment in ESCs.
b. IGV tracks of the Tfcp2l1-Gli2 locus showing the two enhancers chosen for functional validation, Enhancer 3 and 14. H3K27ac Hi-ChIP derived arcs originating from both enhancers are shown as well. RT-qPCR showing relative expression levels of Tfcp2l and Gli2 upon CRISPRi perturbation of Enh3 compared to control cells infected with empty vector (EV). Dots indicate independent experiments (n=3). Asterisks indicate significance, with p-value <0.05, as calculated using unpaired one-tailed t-test.
c. Schematic showing experimental strategy for generating a stable XEN line expressing dCas-BFP-KRAB (CRISPRi) as shown by the representative FACs plots.
d. AUC curve (red) showing a value of 0.71 when comparing our precited perturbation scores to our experimental validations presented in Fig. 6i for n=40 different E-P pairs.
e. Scatter plot comparing the predicted perturbation scores and the ABC scores for each of the 40 experimentally tested E-P pairs. Spearman Correlation value of −0.49. Different colors indicate different groups reflecting the concordance or discordance between predictions and experimental validations as shown in Fig.6i. TP: true positive, TN: true negative, FP: false positive, FN: false negative.
Note: all statistics are provided in Supplementary Table 9.
