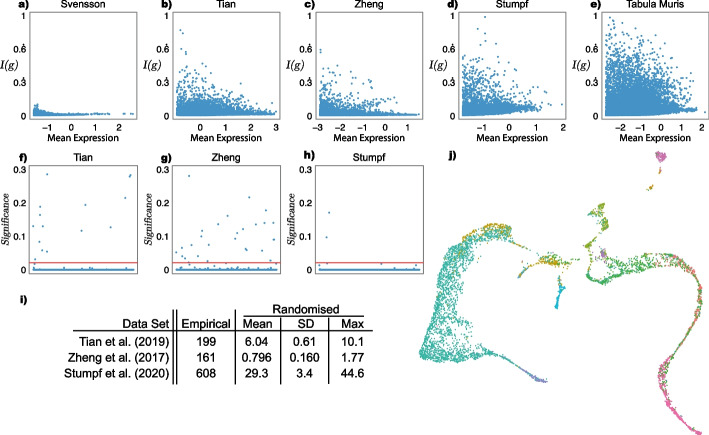
Fig. 2.
Information-theoretic single-cell analysis. Recall that I(g) measures the heterogeneity of a cellular population with respect to the expression of g: when transcripts are expressed uniformly and increases as transcripts are expressed preferentially in a subset of cells, reaching a maximum , where N is the number of cells sequenced, when only one cell expresses the gene. a–e Plots of expression heterogeneity, I(g) (normalised by the theoretical maximum, ) against log mean expression for the bench-marking sc-Seq data sets described in the main text. In each panel, each point represents a gene profiled. The number of genes associated with large values of I(g) increases with the number of cell types present in the population profiled, showing I(g) as a valid measure of cell type diversity. Panel a shows data from a technical control [42] (number of cell types, ), b a mixture of three cancerous cell lines [46] (), c FACS sorted immune cells [52] (), d a sample of mouse bone marrow [41] (), and e a multi-organ mouse cell atlas [44] (). f–h Biologically meaningful cell annotations are associated with high inter-cluster heterogeneity. Established cell annotations for the f Tian, g Zheng and h Stumpf data are associated with higher inter-cluster heterogeneity than expected by chance (i.e., in randomly permuted clusters; significance is assessed using a one-sided exact test with permutations; y axes show ). In all panels the red line shows , false discovery rate corrected for 500 trials [2, 8]. Genes below this threshold are significantly different gene expression patterns across the set of identified cell types. i Summary statistics for the total inter-cluster heterogeneity based on established empirical and randomly permuted cell annotations ( random permutations in each case). These statistics show the strong association of high with biologically meaningful groupings of cells. j A Uniform Manifold Approximation and Projection (UMAP) [29] plot of the top 500 genes by I(g) for the Stumpf data set; each point is a cell, coloured by its scEC cluster. This shows that I(g) is able to capture the continuous variation of developing cell types

