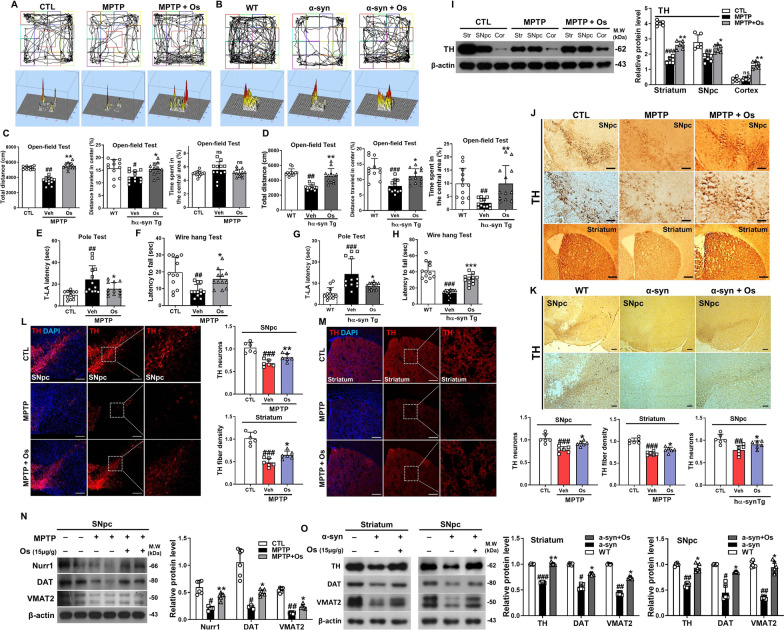
Fig. 1.
Osmotin ameliorates motor dysfunction and upregulates dopaminergic markers. a, c An open field test was performed on MPTP-induced mice (n = 12, biologically independent animals). b, d An open field test was performed on NSE-hαSyn Tg mice (n = 12, biologically independent animals). a, b Top panels represent an illustrative example of the open field test travel pathway and bottom panel represent an example of the global activity map in the open field test of the three groups. e, f Pole and wire hang tests were performed on MPTP-induced mice (n = 12, biologically independent animals). g, h Pole and wire hang tests were performed on NSE-hαSyn Tg mice (n = 10, biologically independent animals). i Western blot analysis of TH expression in MPTP-induced model mice (n = 6, biologically independent animals). j, k Representative images of coronal sections from MPTP/NSE-hαSyn Tg mice showing TH-positive neurons and striatal sections stained for TH immunoreactivity (n = 6, biologically independent animals). Scale bar represents 100 μm. l, m Immunofluorescence analysis of TH immunostaining in the SNpc and striatum of MPTP-induced mice (n = 6, biologically independent animals). Scale bar represents 100 μm. n Immunoblot results of Nurr1, DAT, and VMAT2 in the experimental groups and a graphical illustration (n = 6, biologically independent animals). o Immunoblot results of TH, DAT, and VMAT2 in the striatum and SNpc of NSE-hαSyn Tg mice and the respective bar graphs (n = 6, biologically independent animals). The data are presented as the mean ± SD and are representative of three independent experiments performed in triplicate. Significance was determined by using one-way ANOVA with Bonferroni correction; #Comparison between control and MPTP/NSE-hαSyn Tg mice, *Comparison between MPTP/NSE-hαSyn Tg mice and osmotin-administered mice. #/*p < 0.05, ##/**p < 0.01, and ###/***p < 0.001

