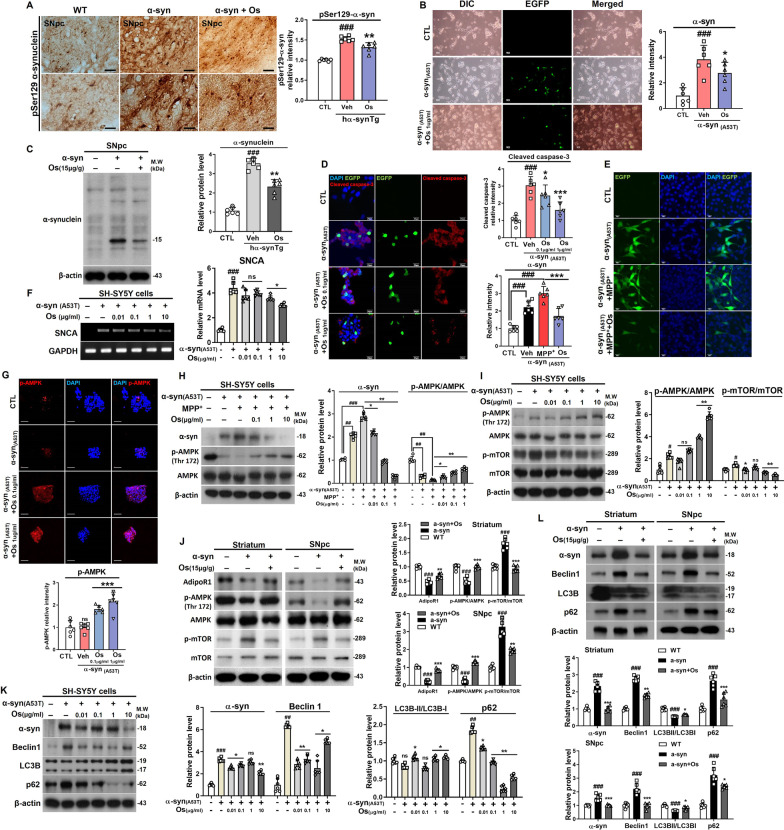
Fig. 2.
Osmotin protects against α-synuclein-induced pathology in vivo and in vitro. a Immunostaining for p-Ser129-α-synuclein in the SNpc of NSE-hαSyn Tg mice (n = 6, biologically independent animals). Scale bar represents 20 μm. b Representative immunostaining of EGFP in α-synuclein (A53T)-transfected SH-SY5Y cells. Scale bar represents 50 μm. c Immunoblot results of α-synuclein in the SNpc of NSE-hαSyn Tg mice (n = 6, biologically independent animals). d Immunofluorescence images of cleaved caspase-3 in α-synuclein (A53T)-transfected SH-SY5Y cells. Scale bar represents 20 μm. e Immunofluorescence images of EGFP in α-synuclein (A53T)-transfected/MPP+-induced SH-SY5Y cells. Scale bar represents 20 μm. f The degree of activation of SNCA was determined by RT‒PCR. g Immunofluorescence images of p-AMPK in α-synuclein (A53T)-transfected SH-SY5Y cells. Scale bar represents 20 μm. j Immunoblot results of AdipoR1, p-AMPK, AMPK, p-mTOR, mTOR in the striatum and SNpc of NSE-hαSyn Tg mice (n = 6, biologically independent animals). h Immunoblot results of α-synuclein, p-AMPK, and AMPK in α-synuclein (A53T)-transfected/MPP+-induced SH-SY5Y cells. i, k, l Immunoblot results of p-AMPK, AMPK, p-mTOR, mTOR, α-synuclein, Beclin1, LC3B, and p62 levels in striatum and SNpc of NSE-hαSyn mice and α-synuclein (A53T)-transfected SH-SY5Y cells. The data are presented as the mean ± SD and are representative of three independent experiments performed in triplicate. Significance was determined by using one-way ANOVA with Bonferroni correction; #Comparison between control and MPTP/NSE-hαSyn Tg mice, *Comparison between MPTP/NSE-hαSyn Tg mice and osmotin-administered mice. #/*p < 0.05, ##/**p < 0.01, and ###/***p < 0.001

