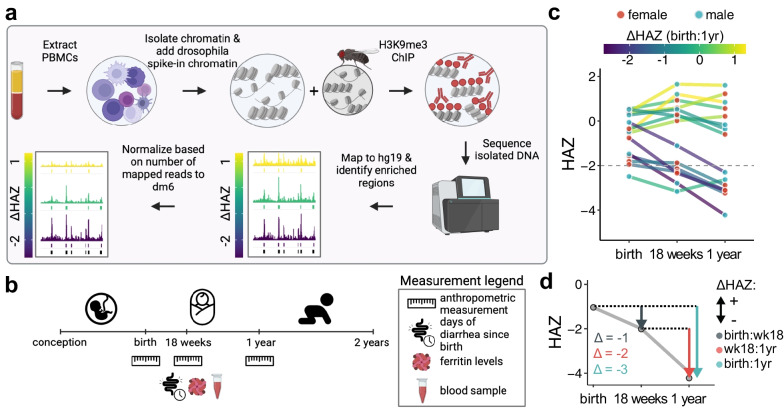
Fig. 1.
Project overview and experimental design. a Experimental overview. b The timeline of early infancy showing sample collection time point and available anthropometry. Blood samples were collected at 18 weeks of age. Additional information used in this study is highlighted in the diagram under the age of a child at the time of information collection. c Overview of the growth trajectories of children whose samples were used in this study. Grey points indicate HAZ score (y-axis) at a given age (x-axis), the growth trajectories are colored based on ΔHAZ between birth and one year, and n indicates the number of individuals. Children with HAZ scores at one year below the dashed line are classified as stunted. d ΔHAZ score explained. Grey line presents growth trajectory of a single individual and is created by connecting HAZ scores (y-axis) at given ages (x-axis). The colored arrows indicate changes in HAZ score between two time points, i.e., ΔHAZ. Dark grey—change between birth and 18 weeks, red—change between 18 weeks and one year, green—change between birth and one year

