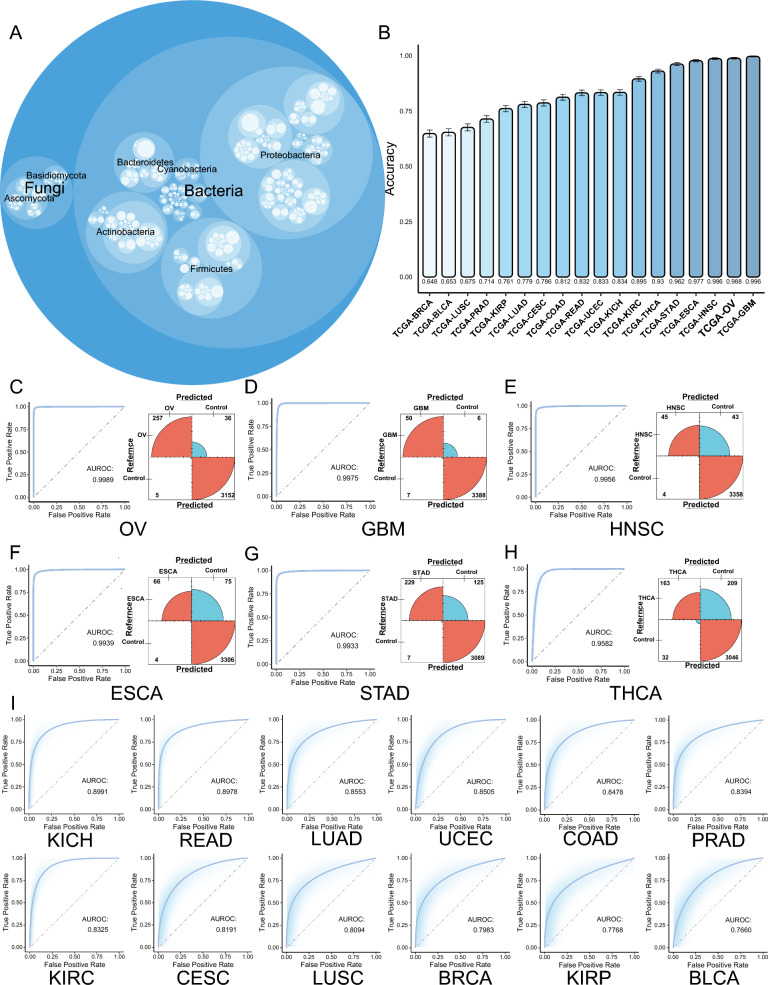
Fig. 4.
OAM is tumor type-specific. A Total composition of OAM in BRCA, BLCA, LUSC, PRAD, KIRP, LUAD, CESC, COAD, READ, UCEC, KICH, KIRC, THCA, STAD, ESCA, HNSC, OV and GBM. The size of the circle represents the number of OAM specie in that category. B Accuracy (y-axis) of ML models in BRCA, BLCA, LUSC, PRAD, KIRP, LUAD, CESC, COAD, READ, UCEC, KICH, KIRC, THCA, STAD, ESCA, HNSC, OV and GBM. C–H ROC curves and confusion matrix for the top six tumors with the highest AUROC. The red color in the confusion matrix represents correct predictions and the blue color represents incorrect predictions. The size of the arcs represents the number of correct predictions. I ROC curves for KICH, READ, LUAD, UCEC, COAD, PRAD, KIRC, CESC, LUSC, BRCA, KIRP and BLCA. TCGA the cancer genome atlas, OAM oncogenome associated microbiome module, BRCA breast cancer, BLCA bladder cancer, LUSC lung squamous cell carcinoma, PRAD prostate cancer, KIRP kidney papillary cell carcinoma, LUAD lung adenocarcinoma, CESC cervical cancer, COAD colon cancer, READ rectal cancer, UCEC endometrioid cancer, KICH kidney chromophobe, KIRC kidney clear cell carcinoma, THCA thyroid cancer, STAD stomach cancer, ESCA esophageal cancer, HNSC head and neck cancer, OV ovarian cancer, GBM glioblastoma, ML machine learning, ROC the receiver operating characteristic, AUROC the area under the curve of the receiver operating characteristic

