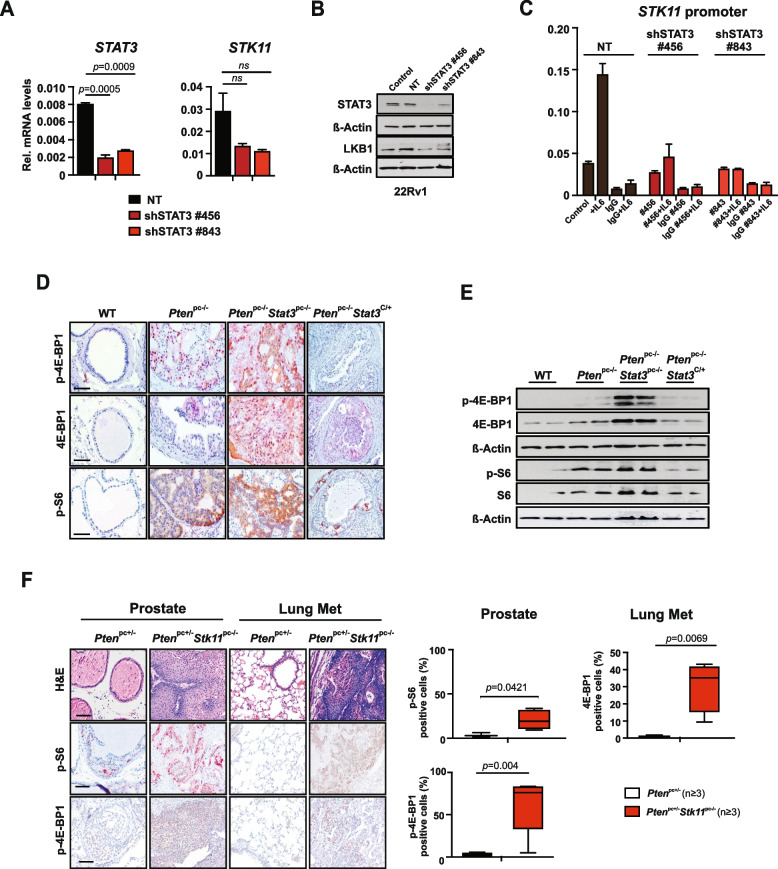
Fig. 2.
STAT3 and LKB1 cooperate to suppress mTORC1. A Western blot analysis of STAT3 and LKB1 in 22Rv1 cells transfected with non-targeting (NT) or shRNAs specific for STAT3 and/or LKB1. B qRT–PCR analysis of STAT3 and STK11 in 22Rv1 cells transfected with NT or shRNA specific for STAT3 (n = 3 each). C ChIP analysis of STAT3 binding to LKB1 (STK11) promoter. 22Rv1 cells harboring NT or two different shSTAT3 constructs were stimulated with IL-6 and immunoprecipated with STAT3 antibody or IgG as a negative control. Bars represent mean ± s.d. from 2 technical replicates. Precipitated DNA is presented as % of input. D IHC analysis of p-4E-BP1, 4E-BP1, p-S6 in prostates from 19-week-old WT, Ptenpc−/−, Ptenpc−/− Stat3pc−/− and Ptenpc−/−Stat3C/+ mice. Scale bars, 100 μm. E Western blots analysis of p-4E-BP1, 4E-BP1, p-S6 and S6 expression in prostates from 19-week-old WT, Ptenpc−/−, Ptenpc−/− Stat3pc−/− and Ptenpc−/−Stat3C/+ mice. β-actin serves as a loading control. F H&E and IHC analyses of Stat3, p-S6 and p-4E-BP1 in prostates and lung metastases from Ptenpc+/− and Ptenpc+/− Stk11pc−/− mice, scale bars, 100 μm. Quantification of cells positive for STAT3 and p-4E-BP1 in 19-week-old Ptenpc+/− and Ptenpc+/− Stk11pc−/− prostate tissue or lung metastases using HistoQuest software (n = 3). Data were analyzed by Student’s t-test and are shown as mean ± s.d

