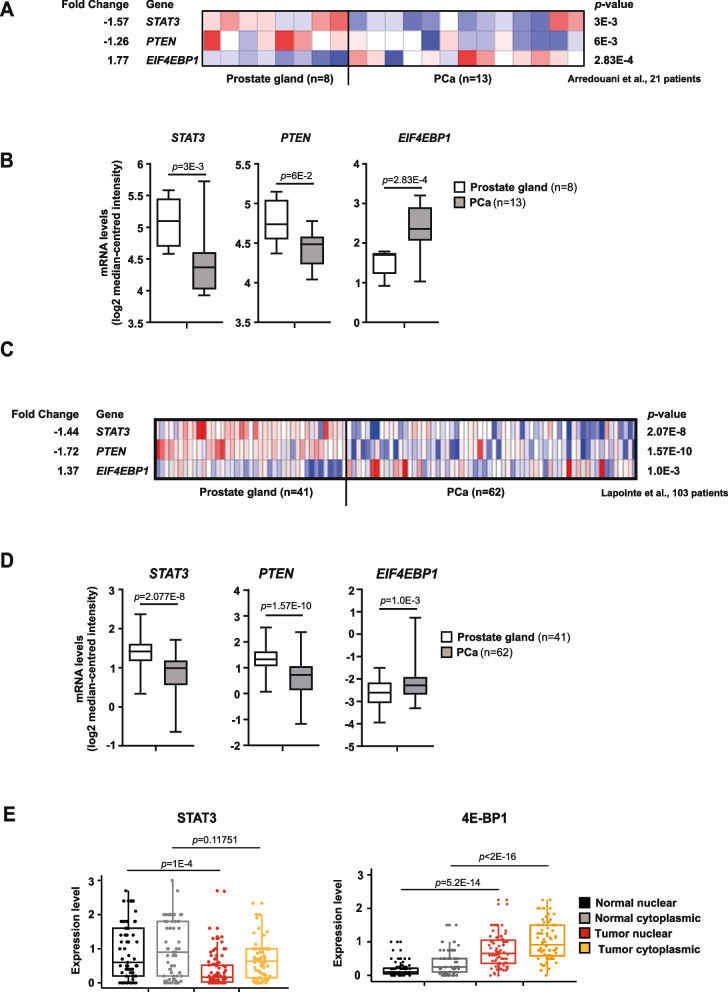
Fig. 5.
STAT3 and PTEN are negatively correlated with mTORC1 in PCa. A Heatmaps depicting significant downregulation of STAT3 and PTEN mRNA levels and concomitant upregulation of EIF4EBP1 mRNA expression in prostate carcinoma patient samples (n = 13) compared with healthy prostate gland tissues (n = 8). Colors were normalized to depict relative mRNA expression values (log2 median-centered intensity) within each row; dark blue represents the lowest relative expression level and dark red represents the highest relative expression level. Data were extracted from the Oncomine™ Platform [59] and from the Arredouani Prostate study [55]. B Gene expression levels depicting significant downregulation of STAT3 (-1.57-fold) and PTEN (-1.26-fold) mRNA and concomitant upregulation of EIF4EBP1 mRNA (1.77-fold) in prostate carcinoma patients (n = 13) compared with normal prostate gland samples (n = 8). Data (log2 median-centered intensity) were extracted from the Oncomine™ Platform from the Arredouani Prostate dataset. Representation: boxes as interquartile range, horizontal line as the mean, whiskers as lower and upper limits. C Heatmap depicting significant downregulation of STAT3 and PTEN mRNA levels and concomitant upregulation of EIF4EBP1 mRNA expression in prostate carcinoma patients compared with normal prostate gland samples (log2 median-centered intensity). Data were extracted from the Oncomine™ Platform from the Lapointe Prostate dataset. D Gene expression levels depicting significant downregulation of STAT3 (-1.44-fold) and PTEN (-1.72-fold) mRNA and concomitant upregulation of EIF4EBP1 mRNA (1.37-fold) in prostate carcinoma patients (n = 59–62) compared with normal prostate gland samples (n = 37–41). Data (log2 median-centered intensity) were extracted from the Oncomine™ Platform from the Lapointe Prostate dataset. Representation: boxes as interquartile range, horizontal line as the mean, whiskers as lower and upper limits. E Boxplots representing protein expression of STAT3 and 4E-BP1 in cytoplasmatic or nuclear stainings detected by IHC in normal-like glands or tumors in PCa patient TMAs (n = 83)

