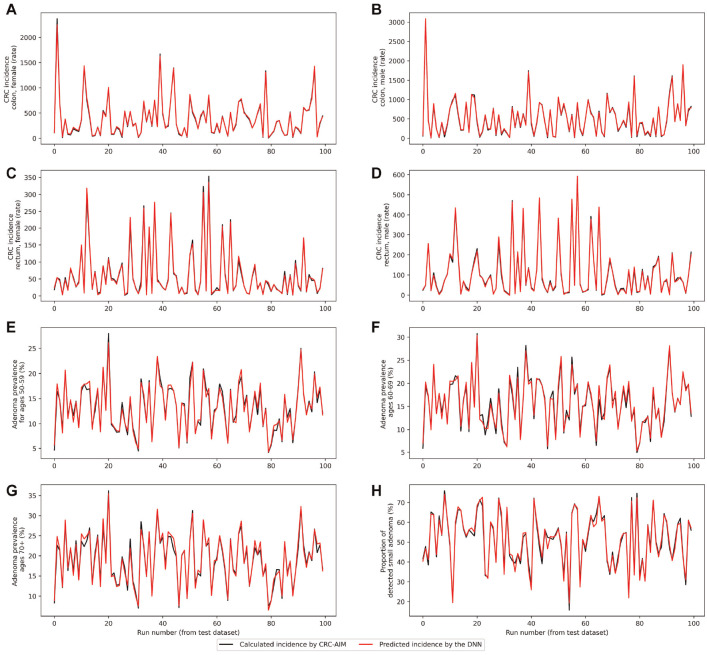
Figure 4.
DNN- and CRC-AIM–predicted outcomes for the first 100 testing input combinations. CRC incidence rate by sex and location is represented in panels A through D, followed by adenoma prevalence by age groups in panels E through G and percentage of small adenoma (≤5 mm) in panel H. Note that the red lines and black lines perfectly overlap for most of the instances; therefore, black lines are often invisible.
CRC, colorectal cancer; CRC-AIM, Colorectal Cancer-Adenoma Incidence and Mortality model; DNN, deep neural networks.

